
The study of hypoglycemic and hypolipidemic activity of Camelina sativa (L.) Crantz extracts in rats under conditions of high-fructose diet
Authors:
Tetiana O. Tsykalo 1; Serhiy D. Trzhetsynskyi 2
Authors‘ workplace:
Department of Pharmacognosy, Pharmacology and Botany, Zaporizhzhia State Medical University
1; Head of the Department of Pharmacognosy, Pharmacology and Botany
2
Published in:
Čes. slov. Farm., 2020; 69, 137-142
Category:
Original article
Overview
The present article discusses the results of the study of the pharmacological activity of plant extracts from Camelina sativa (L.) Crantz: total herb extract (ECS) and oil from seeds (OCS). ECS was obtained from non-fat raw materials by the method of fractional maceration with 70% ethanol. OCS was obtained by means of extraction in a Soxhlet apparatus. Possible hypoglycemic activity of the extracts and dose selection were evaluated by primary pharmacological screening. Maximum hypoglycemic activity for ECS and OCS at a dose of 200 mg/kg was detected. A deeper study of the hypoglycemic and hypolipidemic properties of the extracts was performed on an experimental model of metabolic syndrome in rats that was induced by excessive doses of fructose (20% solution) for 8 weeks. In the last 2 weeks, the animals additionally received extracts and the reference preparation Metformin® (150 mg/kg). The characteristics of glucose homeo-stasis were evaluated by oral glucose tolerance test and short insulin test. The study also examined the content of total cholesterol and triglycerides. It was found that ECS and OCS of Camelina sativa (L.) Crantz at a dose of 200 mg/kg being administered for 14 days under conditions of high-fructose diet statistically significantly inhibited the formation of glucose tolerance and insulin resistance. ECS was found to have a pronounced lipid-lowering effect on lipid metabolism. The obtained results require further study of this plant raw material.
Keywords:
insulin resistance – metabolic syndrome – Camelina sativa (L.) Crantz – glucose tolerance
Introduction
Metabolic syndrome (MS) is one of the topical problems of the modern medicine, which is due to several causes. First, its prevalence in the adult population should be mentioned. Epidemiological studies have shown that in industrialized countries, 15–35% of people aged 40–70 years have all the major indications of MS. Secondly, in people with MS, the risk of developing cardiovascular disease is doubled, and the accidence of type 2 diabetes mellitus (DM) is five times increased compared to individuals without such symptoms1, 2).
The pandemic nature of MS incidence is due to the following factors: increased life expectancy of the population, reduced physical activity and consumption of carbohydrate and fat-rich foods. In Ukraine, today the number of people with MS is about 20% of the total population, and 80% is among patients with type 2 diabetes2, 3).
MS is a combination of interrelated metabolic disorders such as insulin resistance (IR), abdominal obesity, hypertension, and hypertriglyceridemia2, 3). MS is one of the most serious causes of type 2 diabetes, which is the most common metabolic disease in the world1, 4, 5).
MS therapy is aimed at the correction of the metabolic disorders that are subject to modification. This includes reduction of excess body weight and obesity treatment, increase of physical activity, correction of impaired glucose tolerance and treatment of type 2 diabetes, dyslipidemia, and hypertension4).
Phytotherapy has long been used in the complex therapy for these pathologies. Many herbal remedies for the treatment of MS, IR and type 2 diabetes have centuries-old empirical experience in folk medicine and at present are complemented by new scientific data of their action mechanism6).
Since ancient times, plants have been an exemplary source of medicines. More than 200 plant species have hypoglycemic and hypolipidemic properties that have been evaluated by screening tests without in-depth study of the mechanism of action7, 8). Herbal preparations contain several types of biologically active compounds that act by means of several mechanisms and in several directions9). In addition to hypoglycemic properties, herbal preparations demonstrate a wide range of pharmacological actions (hypolipidemic, antioxidant, hepatoprotective, nephroprotective, improve tissue microcirculation) and have minimal side effects10).
Plants that have long been known in folk medicine but are still not well understood are of a particular interest. One of these is the annual plant Camelina sativa (L.) Crantz (false flax), which belongs to the genus Camelina (L.) Crantz, the family Brassicaceae. It is known that in traditional medicine Camelina sativa (L.) Crantz herb and oil are used as bactericidal, anti-inflammatory, wound healing, hypolipidemic medicines, as well as for the treatment of obesity and diabetes11, 12). Today, the interest in Camelina sativa (L.) Crantz has significantly grown, mostly due to the fact that it is an oil crop used for biodiesel production in the US, Russia and other countries. In Ukraine, Camelina sativa (L.) Crantz is industrially grown in Rivne, Volyn, Chernihiv and Kyiv regions13).
Given the epidemic nature of MS incidence, the urgent issue is the development of new and safe drugs that can prevent the progression of metabolic disorders inherent in this symptom complex.
The aim of our work was to investigate the possible hypoglycemic and hypolipidemic activity of a total extract and oil seed from Camelina sativa (L.) Crantz.
Experimental part
Plant materials
Raw material was grown and harvested in the territory of Zaporizhzhia region (Ukraine) in the summer of 2018. C. sativa herb was harvested at the start of the flowering stage. C. sativa seeds were harvested when 60–70% of the ripe fruits were ripe to prevent mass rash. Samples of seeds for cultivation were provided by the National Center for Plant Genetic Resources of Ukraine (The Plant Production Institute named after V. Y. Yuriev, NAAS of Ukraine, Kharkiv).
Preparation of extracts
For the study, a total extract of herb (ECS) and seed oil (OCS) of Camelina sativa (L.) Crantz variety Slavutych were used. Experimental preparations were obtained from plant raw materials at the Department of Pharmacognosy, Pharmacology and Botany at ZSMU. To obtain a total extract, dried and fine-cut raw material was degreased in a Soxhlet apparatus. Non-greasy raw material was dried overnight, after which it was extracted with 70% ethanol in a ratio of 1 : 5 at room temperature by fractional maceration for 3 days. The extract was precipitated for two days at a temperature of less than +10 °C, then it was filtered and evaporated in a rotary evaporator until a dense consistency was obtained.
The oil was obtained by extraction in a Soxhlet apparatus using hexane, with further removal of the extractant under vacuum.
Phytochemical screening of Camelina sativa (L.) Crantz extracts
The preliminary phytochemical screening ECS was performed using generally accepted methods and techniques of phytochemical analysis. Flavonoids were determined in the total extract of the herb in the reactions of identification: cyanidine reaction by Bryant, the reaction with 3% solution of iron (III) chloride; the reaction with an alkaline solution; the reaction with 5% solution of aluminium chloride. To determine tannins, the reactions of the sediment were carried out with 1% gelatine solution, 1% solution of quinine hydrochloride, 10% solution of basic acetate of lead. The group of tannins was detected by the reaction with a solution of iron ammonium alum14).
The determination of fatty acids in oil was performed by gas chromatography.
Quantification of main groups of BACs
In the total extract of herb C. sativa, the sum of the flavonoids were quantified by the method of differential spectrophotometry with aluminium chloride (as rutin, λ = 408 nm)15); hydroxycinnamic acids was determined by direct spectrophotometry (as chlorogenic acid, λ = 525 nm)16); polyphenols were quantified by direct spectrophotometry (as gallic acid, λ = 270 nm)17). All assays were performed in triplicate.
Animals
The studies were carried out on white sexually mature rats of the Wistar line weighing 180–200 g. The rats were obtained from the breeding nursery of the State Institution “Institute of Pharmacology and Toxicology of the Academy of Medical Sciences of Ukraine”. Experimental rats were kept in a vivarium in standard conditions with access to water ad libitum.
All manipulations were carried out in accordance with the accepted bioethical standards, observing the relevant rules of the ICH (International Conference on Harmonization), the Law of Ukraine “On the Protection of Animals from Cruel Treatment” (No. 2447-IV of 04.08.2017), and the rules of the European Convention for the Protection of Vertebrate Animals used in experimental research and for different purposes dated March 18, 1986.
Primary pharmacological screening and dose selection
The possible hypoglycemic activity of the extracts was evaluated by changes in blood glucose concentrations after a single administration of ECS and OCS. The examination was performed on animals that used to receive standard carbohydrate feed for a week and had a night starvation before the study. The examination was performed on animals that usually received standard carbohydrate feed for a week and were starved before the study18). An emulsion of ECS and OCS with Tween® 80 (0.2 g per 1 g of extract) were administered orally by gastric tube at the dose of 100 mg/kg, 200 mg/kg and 300 mg/kg of bodyweight18). In addition to the group of animals that consumed ECS and OCS, a control group was formed that received placebo – distilled water in an equivalent amount. There was also the reference group, and Metformin® was used as the reference drug.
Blood glucose levels were measured using the glucose oxidase method with One Touch Select glucometer (Johnson & Johnson, USA). Blood samples for analysis were taken through lateral tail vein before and 2, 4, 6, and 8 hours after the feeding.
For a deeper study of the hypoglycemic and hypolipidemic properties of ECS and OCS, studies have been conducted on an experimental model of metabolic syndrome.
Experiment design on the modelled metabolic syndrome
It is known that the consumption of high doses of fructose in food may be one of the factors leading to the development of obesity, which is closely associated with the risk of developing MS and type 2 diabetes. In addition, some studies have shown that long-term high-fructose diets in a relatively short period of time lead to IR and impaired glucose tolerance in normal rats. Thus, rats receiving high-fructose water could serve as a model for studying insulin resistance19–22).
Therefore, MS, namely IR, was induced by excessive doses of fructose. For the study, experimental rats were divided into 5 groups (n = 6). Group I (intact rats) and groups II, III, IV, V received 20% solution of fructose (Golden Farm, Ukraine) instead of water for 8 weeks. During last 2 weeks the FF fructose-fed (FF) groups also received the following drugs orally through the gastric probe: group I and II (control group) – rats received distilled water in equivalent volume, group III – rats received an emulsion of ECS (200 mg/kg of body weight) with Tween® 80 (0.2 g per 1 g of extract), group IV – rats received an emulsion of OCS (200 mg/kg of body weight) with Tween® 80 (0.2 g per 1 g of extract), V – rats received Metformin® (150 mg/kg body weight)as a suspension, stabilized by Tween® 80 (0.1 g per 1 g of extract) as a standard medication21).
The characteristics of glucose homeostasis were assessed using the oral glucose tolerance test (OGTT) and the short insulin test.
Oral glucose tolerance test
OGTT was carried out after animals had been starving during the night. Glucose at a dose of 3 g/kg of body weight was administered orally with a gastric tube. The estimation of glucose in the blood was carried out by means of the glucose oxidase method using the One Touch Select glucose meter (Johnson & Johnson, USA). Blood samples for analysis were taken from the tail vein 30, 60 and 120 minutes before and after the administration of glucose.
Additionally, the glycemic response during OTTG was estimated by the value the integrated index of area under the glycemic curves (AUC) (mmol/L · min), which was calculated using the computer program “Mathlab”18).
Short insulin test
This test assesses the sensitivity of both the liver and peripheral tissues to the action of insulin, considering the inhibition of glucose production in the liver and the increase in muscle glucose utilization due to the hormone effect (Novo Nordisk, Denmark). Insulin sensitivity is estimated by calculating the percentage of reduction in the basal glycaemia 30 minutes after intraperitoneal administration of the hormone to starving animals (1 U/kg of body weight)18).
Body weight
The body weight of the rodents was measured weekly for the duration of the experiment.
Lipid profile
The study examined the biochemical parameters of blood serum – the content of total cholesterol (TC) and triglycerides (TG). The levels of TC and TG in the blood serum of rats were estimated by the enzymatic method using a standard reagent kit produced by Felicit Diagnostic (Ukraine)23).
Statistical analysis
All results were expressed by the equation mean ± SEM. One-way ANOVA test was used for statistical analysis followed by Mann-Whitney U test and the Student’s Criteria using Excel-7.0 and STATISTICA® v.13 software (license No. JPZ804I382130ARCN10-J). Differences of p ˂ 0.05 were considered to be statistically significant.
Results and discussion
Phytochemical screening of total extract of herb and oil from seeds C. sativa
The phytochemical screening of total extract revealed the presence of flavonoids and polyphenolic compounds. Fatty acids were identified by gas chromatography.
Quantification of main groups of BACs
The quantitative BACs content of the total extract of herb C. sativa was determined: flavonoids – 5.15 ± 0.26%; hydroxycinnamic acids – 4.52 ± 0.03%, polyphenolic compounds – 6.05 ± 0.16 %.
As a result of the chromatographic study of C. sativa seed oil, the highest content of linoleic acid (1913.92 mg/kg) and oleic acid (202.62 mg/kg) was established.
Primary pharmacological screening and dose selection
As a result of the primary pharmacological screening, the hypoglycemic activity of ECS and OCS revealed their dose-dependent ability to reduce glucose.
Maximum hypoglycemic activity was detected with the use of ECS and OCS at a dose of 200 mg/kg. Increasing the dose to 300 mg/kg did not lead to an increase in hypoglycemic activity. Therefore, for further studies, a dose of ECS and OCS of 200 mg/kg was selected, since it is not advisable to use a larger dose in the absence of statistical differences.
Oral glucose tolerance test
After a two-month high-fructose diet, the analysis of glucose tolerance test showed impaired tolerance in animals.
Thus, in the control group there was an increase in glucose at the 30th minute of OGTT (during the maximum rise in blood glucose levels in experimental rats in response to oral carbohydrate loading) by 14.3% relative to intact control. At the same time, the introduction of experimental drugs – ECS and OCS – caused a decrease in glucose levels by 30.3% and 24.7% relative to the control group, respectively, and was not statistically different from the intact control group, indicating the presence of hypoglycemic activity of these extracts.
In 120 min, the level of glycemia in intact rats was almost recovered, and in rats under placebo action it was by 20.3% higher, which clearly demonstrated the formed glucose metabolism disorders in these experimental animals. The introduction of ECS, OCS, and Metformin® to animals prevented the development of such abnormalities, as confirmed by glycemic curves. At the end of the test, the level of glycaemia was not significantly different from the initial values in rats under the influence of ECS and OCS. In the group of experimental animals which were administered the reference drug, glucose levels almost recovered after 120 minutes from the OGTT onset (Fig. 1).
# p < 0.05 – statistically significant differences compared to indicators of intact control
⃰ p < 0.05 – statistically significant differences compared to the control group
@ p < 0.05 – statistically significant differences compared to the parameters of the group of drug reference
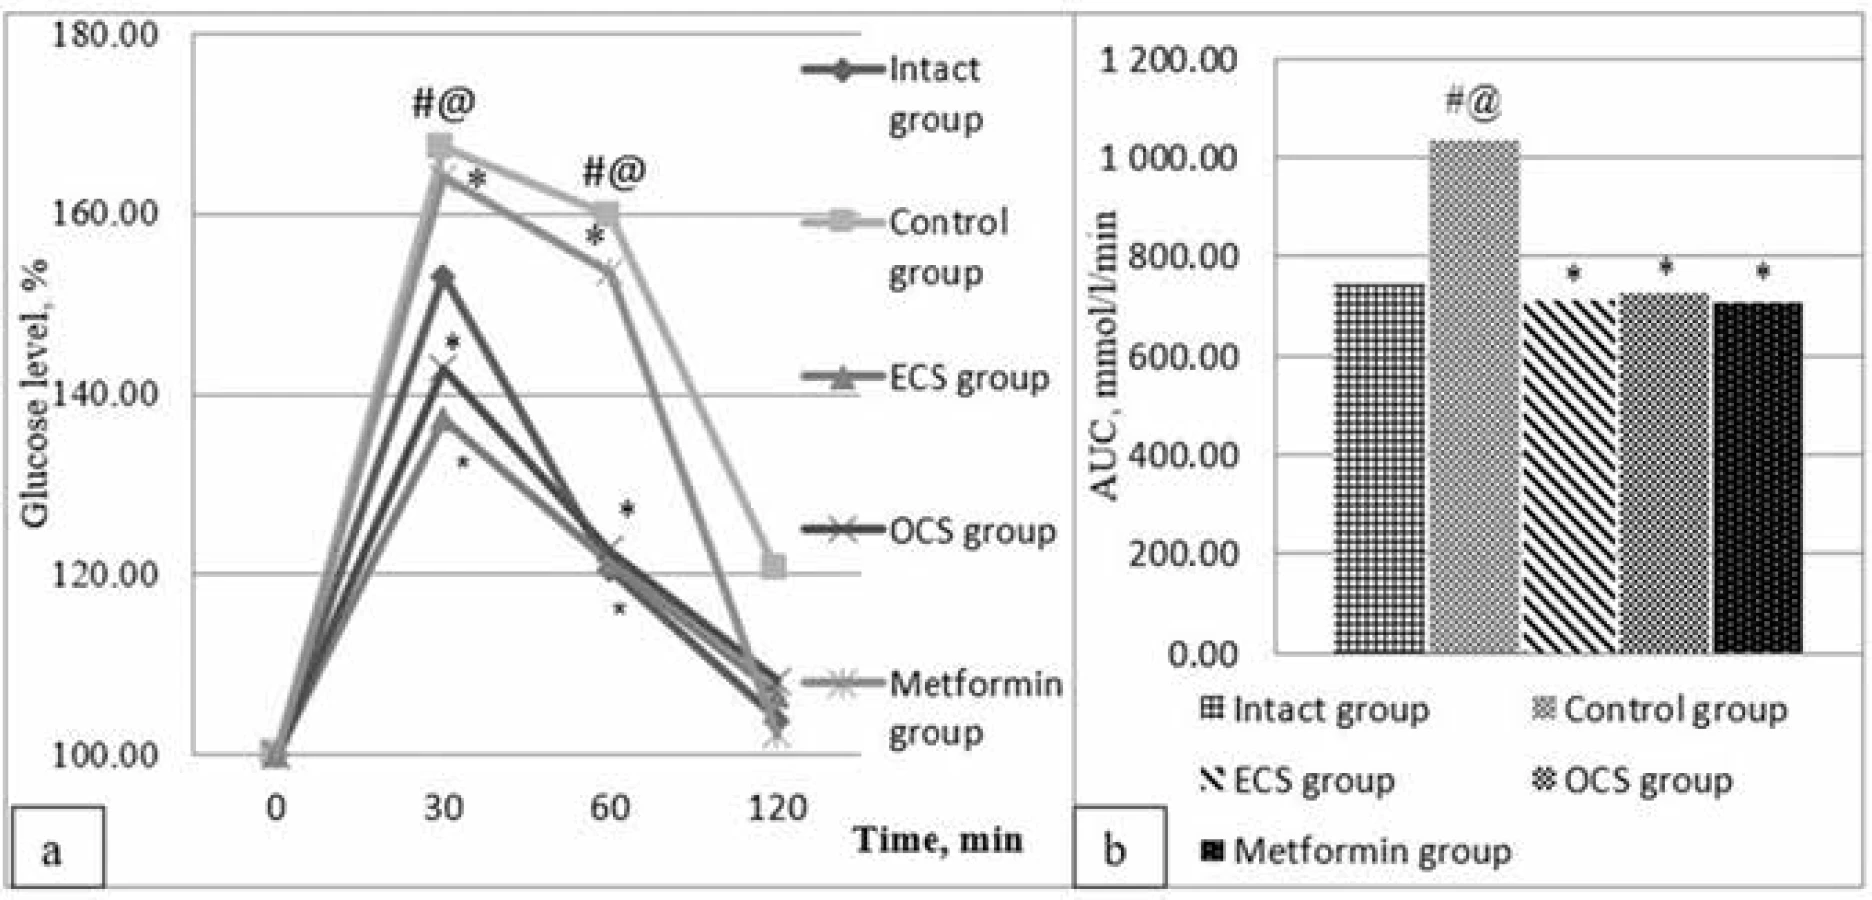
The pronounced hypoglycemic activity of ECS and OCS was not inferior to that of the comparator drug Metformin®. This was confirmed by the results of a comparative analysis of the area under glycemic curves, which is an integral parameter of the glucose loading assessment.
As a result of the OTTG, it is estimated that AUC in the control group is almost 1.4 times larger than the corresponding area in the intact control group (1034.4 mmol/l·min and 746.1 mmol/l · min, respectively). At the same time, AUC in the groups of animals who had been administered ECS (712.2 mmol/l · min), OCS (725.1 mmol/l · min) and the reference preparation Metformin® (709.9 mmol/l · min) did not significantly differ from the corresponding area in the intact control group, indicating a decrease in glucose tolerance in these groups of experimental animals (Fig. 1).
Short insulin test
During the short insulin test in rats under conditions of FF, it was found that in the intact group glucose level had decreased by 57.63% 30 min past insulin administration, and in the control group by 36.71%, confirming the development of IR. In ECS, OCS, and the reference preparation groups, the percentage of glucose reduction was not statistically different from the intact group (53.24%, 52.77%, and 52.85%, respectively). This indicates the inhibition of the IR development in the above groups of rats.
Body weight
At the beginning of the experiment, there was no significant difference between the initial body weights of the study groups. After 8 weeks of high-fructose diet, a statistically significant increase in body weight of the control group was observed, in comparison with the intact group. The introduction of ECS attenuated this effect because the weight gain in this group was statistically smaller not only in comparison with the control group, but also in comparison with the group receiving the reference drug. At the same time, the introduction of OCS did not weaken the effect of fructose on weight gain and had no significant difference with the indicators of the control group (Fig. 2).
# p < 0.05 – statistically significant differences compared to indicators of intact control
⃰ p < 0.05 – statistically significant differences compared to the control group
@ p < 0.05 – statistically significant differences compared to the parameters of the group of drug reference

Lipid profile
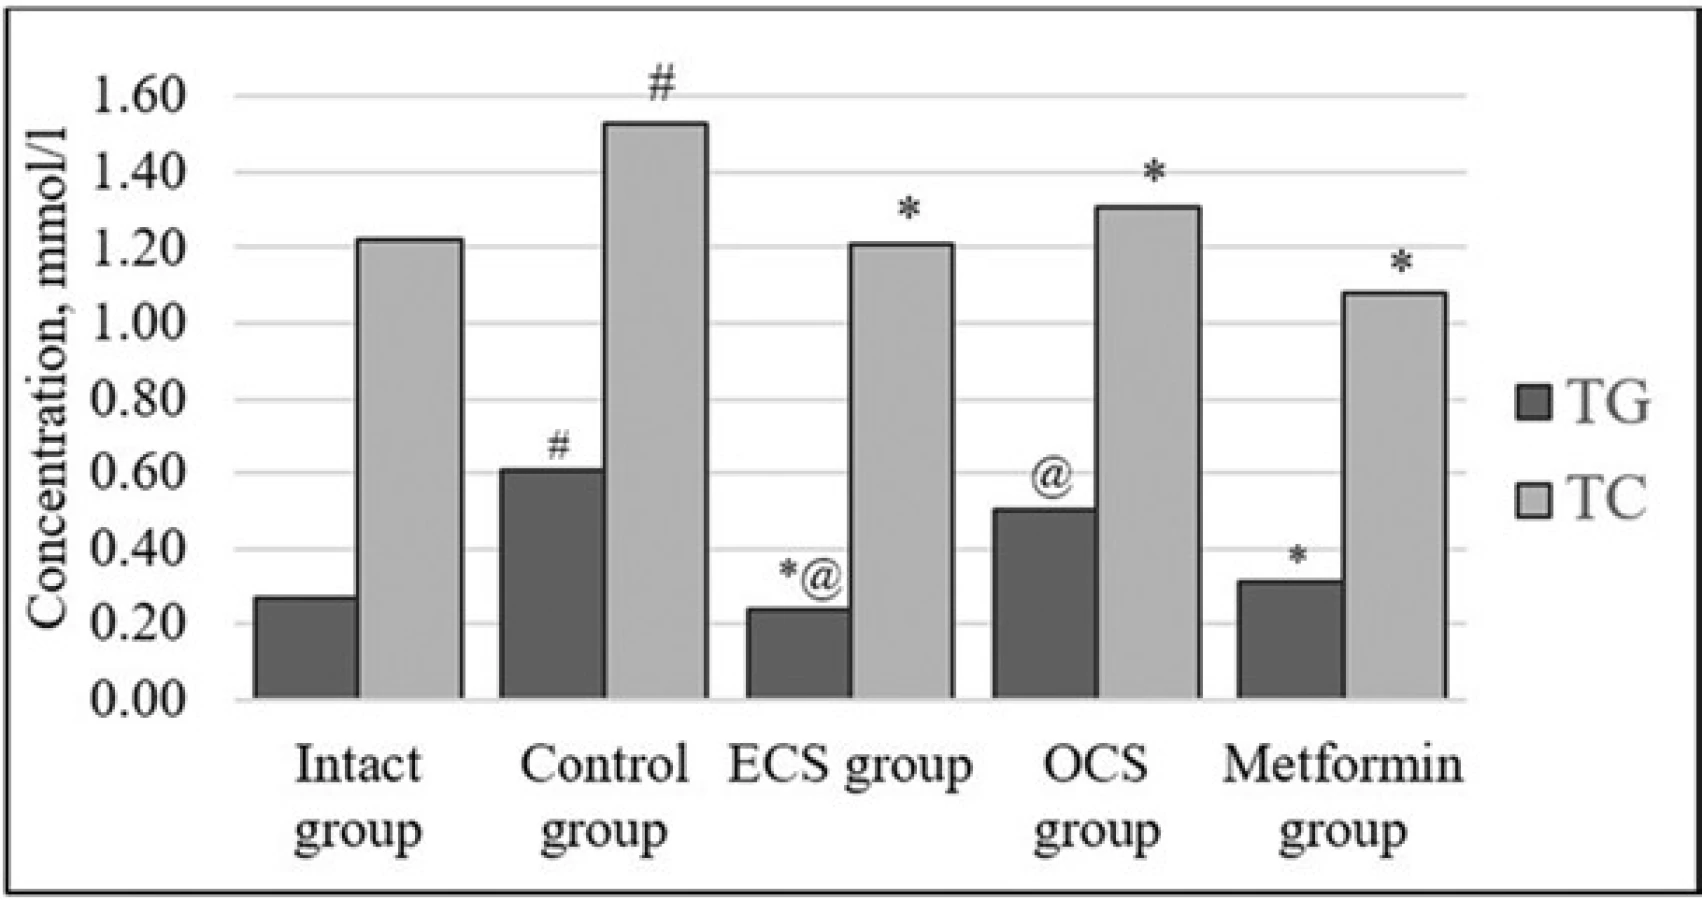
As a result of the studies, it was found that two-month fructose administration leads to an increase in the concentration of LC and TG relative to the parameters observed in intact animals. These changes in the concentration of LC and TG are likely to be due to regulation of lipolysis and insulin lipogenesis impaired by insulin resistance22).
The introduction of ECS contributed to the improvement of lipid metabolism, impaired under MS, as evidenced by the normalization of TG and a decrease in the concentration of TC in serum, even compared to intact group (Fig. 3).
# p < 0.05 – statistically significant differences compared to indicators of intact control
⃰ p < 0.05 – statistically significant differences compared to the control group
@ p < 0.05 – statistically significant differences compared to the parameters of the group of drug reference
Thus, as a result of a pharmacological study, it was found that a total herb extract and oil of the seeds of Slavutich Camelina sativa (L.) Crantz, administered orally at a dose of 200 mg/kg for 14 days under the conditions of FF statistically significantly inhibited the formation of insulin resistance and restored glucose tolerance. This is confirmed by the results of OGTT and the calculated AUC. In addition, the total extract of herb had a more pronounced hypolipidemic effect on lipid metabolism, even compared to the reference drug.
Conclusions
Experimental drugs obtained from raw false flax have the ability to inhibit the formation of insulin resistance, hyperlipidemia and restore glucose tolerance against the background of experimental metabolic syndrome in rats. This requires further and deeper study of this herbal raw material in order to create new drugs based on it, for the comprehensive treatment of metabolic syndrome and type 2 diabetes.
Conflicts of interest: none.
Tetiana O. Tsykalo, PhD student (∗)
Department of Pharmacognosy, Pharmacology and Botany
Zaporizhzhia State Medical University
Maiakovskyi avenue 26, 69035 Zaporizhzhia, Ukraine
e-mail: tetyanatsykalo@ukr.net
S. D. Trzhetsynskyi
Head of the Department of Pharmacognosy, Pharmacology and Botany
Zaporizhzhia State Medical University, Zaporizhzhia, Ukraine
Sources
1. Alberti K. G. M. M., Zimmet P., Shaw J. Metabolic syndrome – a new worldwide definition. A Consensus Statement from the International Diabetes Federation. Diabet. Med. 2006; 23(5), 469–480.
2. Grundy S. M. Metabolic syndrome pandemic. Arterioscler. Thromb. Vasc. Biol. 2008; 28(4), 629–636.
3. Mishchenko L. A. Metabolic syndrome. Health of Ukraine 2007; 10, 24–25 (in Ukraine).
4. Vollenweider P., von Eckardstein A., Widmann C. HDLs, Diabetes, and metabolic syndrome. Handbook of Experimental Pharmacology 2014; 224, 405–421.
5. International Diabetes Federation Diabetes Atlas – 8th edition. http://www.diabetesatlas.org (09. 12. 2019).
6. Governa P., Baini G., Borgonetti V., Cettolin G., Giachetti D., Magnano A. R., Miraldi E., Biagi M. Phytotherapy in the Management of Diabetes. A Review Molecules 2018; 23(1), 105–127.
7. El-Soud N. A, El-Laithy N., El-Saeed G. Antidiabetic activities of Foeniculum vulgare Essential oil in streptozotocin – induced diabetic rats. Macedonian J. Med. Sci. 2011; 4, 139–146.
8. El-Abhar H. S., Schaalan M. F. Phytotherapy in diabetes: Review on potential mechanistic perspectives. World J. Diabetes 2014; 5(2), 176–197.
9. Kar A., Choudhary B. K., Bandyopadhyay N. G. Comparative evaluation of hypoglycaemic activity of some Indian medicinal plants in alloxan diabetic rats. J Ethnopharmacol. 2003; 84, 105–108.
10. Zhao C., Wu Y. J., Yang C. F., Liu B., Huang Y. F. Hypotensive, hypoglycemic and hypolipidemic effects of bioactive compounds from microalgae and marine microorganisms. International J. of Food Science and Technology 2015; 50(8), 1705–1717.
11. Shevchenko I. A., Polyakov O. I., Vedmedeva K. V., Komarova I. B. Camelina, Carthamu, Sesamum. Strategy of production of oilseeds in Ukraine (rare crops). Zaporizhzhia; STATUS 2017; 40 p. (in Ukraine).
12. Kris S., Stuebiger G., Bail S., Unterweger H. Analisis of voliate compounds and triacylglycerol composition of fatty seed oil gained from flax and false flax. European J. of Lipid Science and Technology 2006; 108(1), 48–60.
13. Demydas G. I., Kvitko H. P., Hetman N. Y. Camelina sativa – oilseed which is alternative to rape ravine in biodiesel production. Proceeding of VNAU 2011; 8(48), 3–8 (in Ukraine).
14. Shinkovenko I. L., Kashpur N. V., Ilyina T. V., Kovalyova A. M., Goryacha O. V., Koshovyi O. M., Toryanyk E. L., Kryvoruchko O. V. The immunomodulatory activity of the aqueous extract and complexes of biologically active compounds of Galium verum L. herb. Ces. slov. Farm. 2018; 67, 25–29.
15. Butnariu M., Coradin C. Z. Evaluation of biologically active compounds from Calendula officinalis flowers using spectrophotometry. Chem. Cent. J. 2012; 6(1).
16. Yezerska O., Kalynyuk T., Vronska L. Quantitative determination of hydroxycinnamic acids atic and nonhepatic effects of fructose, fructose-induced inflammation of low gradations. Nutrition problems 2012; 3/4, 12–22 (in Ukraine).
17. Voloshyna A. A., Kyslychenko V. S., Zhuravel I. O., Burda N. Ye. The study of quantitative content of phenolic compounds in the greater mullein plant material. Ukrainian Journal of Clinical and Laboratory Medicine 2012; 7(4), 202–203 (in Ukraine).
18. Stefanov A. V. Preclinical studies of drugs. Kyiv: Avicenna 2002; 568 p. (in Ukraine).
19. Bocarsly M. E., Powell E. S., Avena N. M., Hoebel B. G. High-fructose corn syrup causes characteristics of obesity in rats: increased body weight, body fat and triglyceride levels. Pharmacol. Biochem. Behav. 2010; 97(1), 101–106.
20. Khitan Z., Kim D. H. Fructose: a key factor in the development of metabolic syndrome and hypertension. J. Nutr. Metab. 2013; 2013, 1–12.
21. Klevanova V. S., Trzhetsynskiy S. D. Antidiabetic activity of blood burnet extract in high fructose fed insulin resistant rats. Journal of Pharmacy and Pharmacology 2015; 3, 425–433.
22. Zalesskij V. N., Velikaya N. V. Molecular and biochemical mechanisms of development of hepatic and nonhepatic effects of fructose, fructose-induced inflammation of low gradations. Nutrition problems 2012; 3/4, 12–22 (in Ukraine).
23. Buccolo G. Quantitative determination of serum triglyceride by use of enzymes. Clin. Chem. 1973; 5, 476–482.
Labels
Pharmacy Clinical pharmacologyArticle was published in
Czech and Slovak Pharmacy

2020 Issue 3
Most read in this issue
- Medicinal products with controlled drug release for local therapy of inflammatory bowel diseases from perspective of pharmaceutical technology
- Ingavirin might be a promising agent to combat Severe Acute Respiratory Coronavirus 2 (SARS-CoV-2)
- Metal complexes in medicine and pharmacy – the past and the present III
- A pharmacodynamic study of a new gel containing an extract of Aloe vera and an extract of oak bark for potential treatment of periodontal diseases