
PREMATURE INFANT BLOOD VESSEL SEGMENTATION OF RETINAL IMAGES BASED ON HYBRID METHOD FOR THE DETERMINATION OF TORTUOSITY
Authors:
Alice Krestanova 1; Jan Kubicek 1; Marek Penhaker 1; Juraj Timkovic 2
Authors‘ workplace:
VSB-Technical University of Ostrava, Ostrava, Czech Republic
1; Clinic Ophthalmology, University Hospital Ostrava, Ostrava, Czech Republic
2
Published in:
Lékař a technika - Clinician and Technology No. 2, 2020, 50, 49-57
Category:
Original research
doi:
https://doi.org/10.14311/CTJ.2020.2.02
Overview
The paper deals with the segmentation of the retinal vascular system using hybrid methods as morphological operations for the purpose of highlighting the extraction of blood vessels and tortuosity. Up to now tortuosity has been evaluated through a visual comparison of the retinal images. The output is an extracted retinal binary image with a blood vessel map. For this reason, a model was suggested that can automatically indicate the tortuosity of the retinal blood vessels by setting a threshold of the blood vessel curvature. This paper used a dataset of images (2800 images) from a RetCam3 device. Before applying the image processing, 30 images were selected with pre-plus diseases diagnosed, and this was divided into two groups with low contrast and higher contrast images. Part of the work is to determine the level of the tortuosity symptom by setting a threshold. Comparing the results with this processing method is not possible because the reference methods of image processing are based on fundus camera scanning, which has twice the resolution. This camera is not used for premature babies, but for children about one year of age and older or adults. Thus, retinal data for 14-day-old to 1-year-old children are not available for the fundus camera. This is a pilot study for the segmentation and mapping of blood vessels from retinal images taken by RetCam3.
Keywords:
segmentation – retinal blood vessels – Curvature – tortuosity – RetCam3 – map vessels – hybrid methods
Introduction
Segmentation of the retinal vascular system is impor-tant for the evaluation of retinopathy of prematurity. Early detection of this disease makes it possible to suppress blindness that the disease can cause [1]. A combination of hybrid methods can achieve better results in the segmentation of retinal blood vessels and subsequently the calculation of the curvature for an estimate of tortuosity than by using one partial segmentation method. For retinopathy of prematurity (ROP) diagnostics, a RetCam3 camera (Natus Medical Incorporated, California, USA) with a resolution of 640×480 pixels is used. The great advantage of the RetCam3 is the possibility to examine 14-day-old children. The aim of the article is to describe algorithm for segmentation retinal blood vessels from retinal images. The images were taken by RetCam3 camera. The segmentation method is based on hybrid method. The next aim is to describe algorithm for calculation tortuosity of blood vessels.
Retinopathy of Prematurity
Retinopathy of prematurity represents a vasopro-liferative disease, which affects the immature retinal blood vessels of the retina in premature infants. ROP occurs in two stages: acute and chronic. The acute form is defined by the disruption of the formation of imma-ture retinal vessels. For each acute stage of premature retinopathy, a “plus” form, which is characterized by the dilation and tortuosity of the retinal vessels, may be present. The cause of the second form is the formation of retinal fibrovascular membranes which, with its chronic late development, may cause total or partial retinal detachment. Changes in the structure of the reti-na can determine the degree of impairment of the visual function. Retinopathy of prematurity tends to regress spontaneously without permanent anatomical and func-tional consequences. The worst progression of the disease occurs in children born before the 30th week of gestation with a birth weight below 1000 g. The aim of ROP screening is the early detection and timing of treatment of the ROP threshold or pre-threshold stages. Children with retinopathy of prematurity must be ini-tially more frequently invited for medical check-ups, because proper and timely treatment is needed. A de-layed diagnosis can usually cause complete blindness [1, 2].
Tortuosity symptoms
The term tortuosity represents the curvature of arteries and veins. Mild twisting can normally be observed in humans and animals. The curvature of blood vessels can be a symptom of many diseases (for example atherosclerosis, diabetes mellitus, hypertension, etc.).
The reason why the curvature of arteries and veins arises is not sufficiently established. Curvature is also one of the symptoms of ROP [1, 2].
Fig. 1 shows typical retinal images with a physiological curving of the blood vessels and a pathological curving of the blood vessels. The pathological image has greater curving of the blood vessels than the curving in the physiological image. These are images from our database. All images in the paper become from our databases.

The symptom of tortuosity is an indicator of the status and development of the ROP disease. Nowadays, ophthalmologists evaluate tortuosity subjectively through a visual comparison of multiple retinal images, which were taken in periodical intervals or with a French curve. There is no objective method that can be used. So, a subjective evaluation can have a measurement error. The next example can be that more ophthalmologists can have different views on the same image.
Related Works
In several published analyses, the retinal blood vessels were segmented from images taken by the fundus camera. This camera has a twice higher resolution than RetCam3; the fundus camera has 1280×800 pixels and RetCam3 has 640×480 pixels. There is a freely available STARE and DRIVE database for fundus cameras with reference images as the gold standard, but this does not exist for data from RetCam3. A fundus camera is used for the examination of retina in children over one year of age and mainly in adults, whereas RetCam3 is primarily intended for the retina examination of children from 14 days to 1 year old for early ROP detection, which mainly affects premature infants. One of the approaches for the extraction of the blood vessels was using the following techniques: histogram equalization, median filter and thresholding, based on assessing the brightness of each pixel of the retinal vascular system image. To simplify the structure of objects, the mathematical morphology of opening and erosion was used [3].
Another option is to detect blood vessels based on radon transformation, a smoothing transformation. The algorithm detects areas with vascular elements. In the case of a positive agreement, the vascular segment is separated by a linear approximation. By combining site information, the vascular system is obtained from the entire image [4].
The blood vessel profile comes through a discreet Laplace-Gaussian filter across several scales and the maximum response between the output results. This method was applied to retinal images from RetCam3 [5].
Another algorithm has been tested on a dataset of images stored in the DRIVE (Netherlands) and STARE (USA) databases. The method is based on thresholding because it allows the extraction of the vascular bed and the acquisition of a binary image map. Following the acquisition of the binary map of the image, two mathematical morphological operations are applied. The closure operation was the first to carry out dilatation followed by erosion [6].
The analyzed method deals with the rapid segmentation of the blood vessels, which is based on a discrete wavelet transformation. The first segmentation phase is the preprocessing of the captured fundus camera. In order to remove the noise around the vessel, the hysteresis thresholding function and fixed thresholds of 140 and 220 were used. The size of the vessels in the original image corresponds to the segmented vessel size. Subsequently, the fragments are formed, and the binary image of the vascular bed is formed [7].
An approach based on the mathematical method of calculating the circular segment was used to measure tortuosity, for example. In the initialization phase of the algorithm, the individual pixels are scanned. The output of the algorithm is a binary image that identifies the area of the vascular system. This area is represented by a white color spectrum. Non-zero pixels are preserved by a union-find table [8].
The morphological thinning algorithm is applied to the image obtained by the fundus camera for the purpose of detecting the vascular system. Because of the possible failure of the algorithm, transverse and bifurcation segments are found in the vascular skeleton, which are subsequently eliminated [4].
Methods for determining tortuosity, based on curvature measurements, require smoothing systems to remove noise. Adjusting the length of the chord is based on the gradual division of the retina into two parts. In the paper, the tortuosity metric was calculated from parts of the polynomial curve for individual blood vessels [9].
Properties are detected on the principle of finding higher discontinuities in the gradient orientation area. The method works on the principle of a robust creaseedge detector, which is suitable for detecting linear and circular structures [6].
Proposed algorithms for images from DRIVE and STARE taken by fundus camera cannot be applied with different setting parameters to data from RetCam3. Because data from RetCam3 has twice lower resolution than data from the fundus camera, the data has uneven lighting caused by the wide-angle field and high visibility of choroidal vessels associated with insufficient pigmentation of the choroid, artifacts created by movement of the child’s eyes.
Retinal dataset
Retinal data were measured clinically by Faculty Hospital Ostrava, Ophthalmologic Clinic. In cooperation with this institute, we retrieved an anonymized dataset of about 2793 retinal images with clinical notes for processing and evaluating. An ethics committee was not necessary in this case. Data were obtained clinically with informed consent signed by legal representatives with consent to the processing of measured data for research and teaching purposes. The retinal images were taken by RetCam3. The dataset contains records of screening of 65 premature children and 15 children born in the 40th or 41st gestation week. Forty boys and forty girls were screened. The left and right eye were taken in each child. Each child was monitored by the ophthalmologist at the regular check-ups (series). The retinal images were taken from every check-up and the progression of the disease was enrolled.
The red lines in the image represent the blood vessels of the retina. They are typical structures of retinal images. Other observable objects are the optic disc and retinal lesions, which are shown in Fig. 2. The data has a low resolution of around 640×480 pixels. The quality of the images depends on the doctor who was using the retinal camera. It is also important for the patients to be calm, because movement of the eyes causes artifacts in the images. For these reasons, the images are sometimes significantly different. Brightness, sharpness and contrast represent the differences in the quality of the images.

In the dataset, the sex, gestational weeks, birth weight, number of check-ups and diagnosis were monitored in each check-up. Table 1 represents the percentage distribution of gestational age of birth by premature babies in the dataset. Table 1 shows that most of the premature babies who were examined by an ophthalmologist were born in weeks 33–39, or in gestational weeks 29–39. The average value of the gestational age of the examined children was 33.8 weeks. Table 2 shows the percentage distribution of birth weight for the premature babies in our dataset. The highest value was 4040 g and the lowest value of birth weight was 540 g. The average value of the birth weight of the examined children was 2092.3 g.


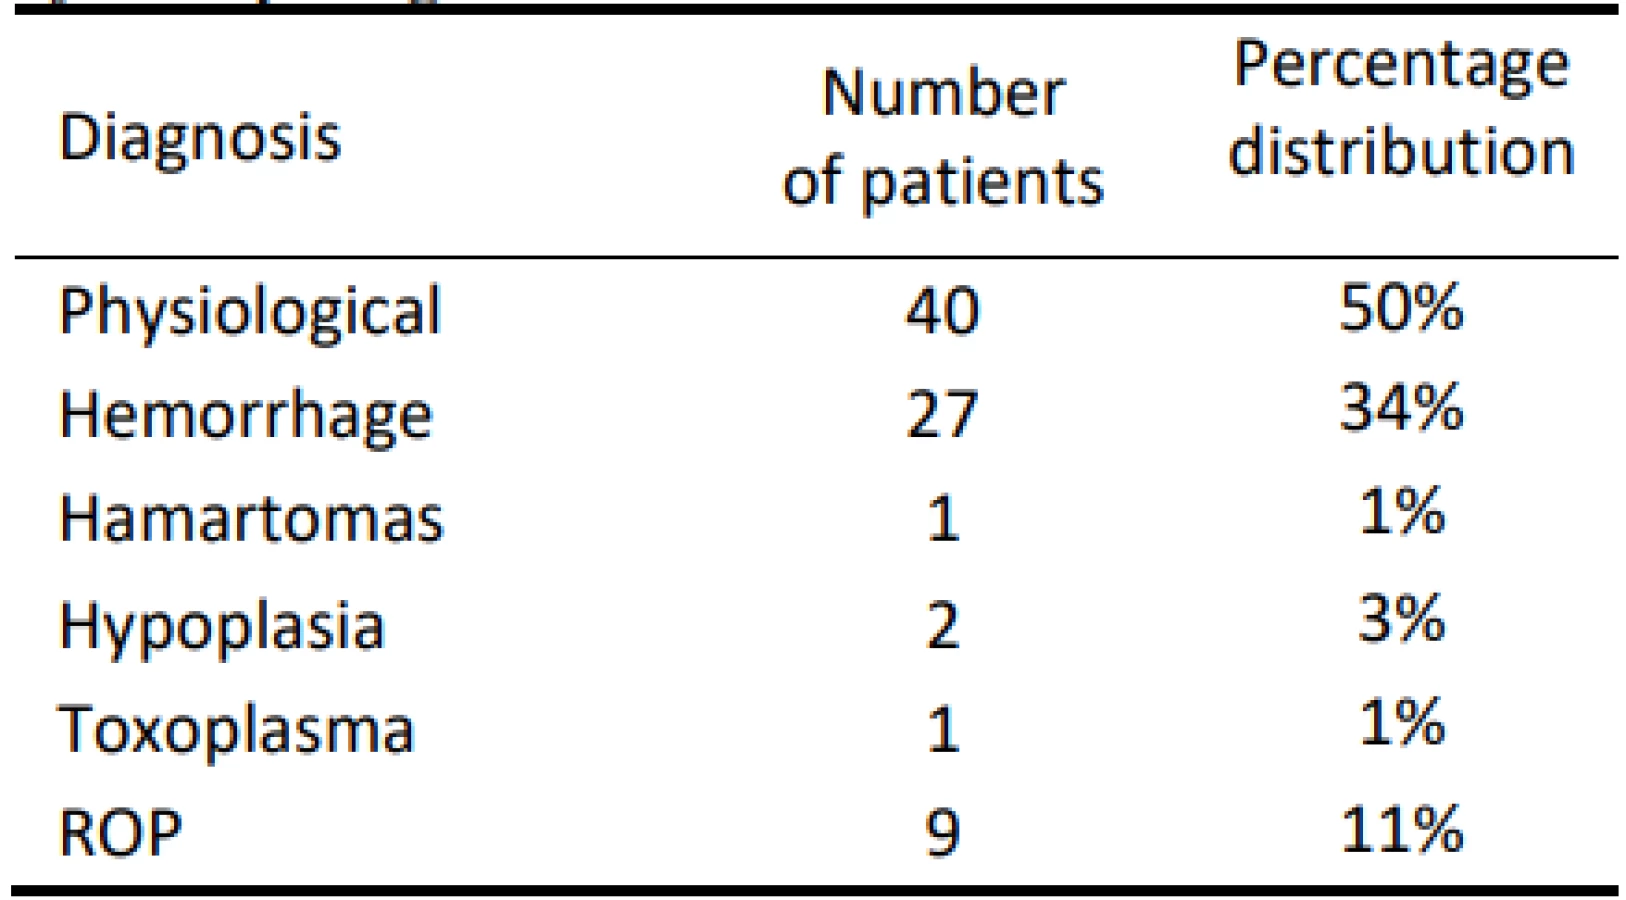
A total of 239 examinations were performed in each series. For each patient, the frequency of medical check-ups was different, because it depends on the diagnosis. Five different diagnoses are in our dataset.
In Fig. 3, there are some retinal images from our dataset with a specified diagnosis by the ophthalmologist: physiological blood vessels, ROP, Hemorrhage, Hypoplasia, Hamartoma, Toxoplasma. In the dataset, there were 9 patients with ROP in stages from 1 to 3. And there is a defined presence or absence of the tortuosity symptom, as well.

Materials and Methods
The segmentation algorithms available in the review are mainly tested on fundus images, which do not contain pathological tortuosity, therefore their deployment should not be a benefit for RetCam3 images. There are differences between these modalities. Our data has a different resolution, contrast, wide-field view. In this capture, the design for vascular segmentation and tortuosity are described. RetCam3 data must be preprocessed to enhance the contrast of the blood vessels against the retinal background. A segmentation procedure based on hybrid methods is applied to the preprocessed data, the result is extracted blood vessels. In our study an algorithm is designed for imaging the tortuosity in each pixel from the segmented retinal image. The segmentation algorithm was tested on 30 images with a classification of ROP and symptom tortuosity. This sample dataset was divided into two groups: contrast and non-contrast images.
Design of Proposed Hybrid Method
First, the preprocessing of the images is performed to achieve the satisfactory results of the segmentation algorithm (see Fig. 4).

The input image is loaded in the algorithm, the image preprocessing has highlighted the blood vessels and then it was possible to apply a segmentation algorithm. The output image of the segmentation is a binary image of the retinal vascular system. Skeletonization is a morphological operation for thinning the retinal blood vessels, while filling holes is an operation for filling the gaps and holes in the segmented retinal vascular system. The result of the proposed algorithm is the segmentation of blood vessels, which is available for the application of the calculation for tortuosity.
Structure of Image Preprocessing
Preprocessing the image allows the retinal blood vessels to be better observable for subsequent segmentation. The process is shown below (see Fig. 5).

The image was divided into three chrominance components red, green, and blue. Image preprocessing uses the extraction of the G chrominance component because it has the highest contrast of blood vessels against the background. The extraction of the green channel is followed by converting the image to grayscale [10–12].
The lightening of the image is achieved with linear brightness transformation. This transformation increases the visibility of the retinal objects. Image sharpening is a method based on emphasizing high frequencies for highlighting sharp edges in the image (see Fig. 6).

A histogram adaptation was used to further increase the contrast of the blood vessels against the background. Median filtration eliminates unwanted noise in the image. This nonlinear filtering method is based on a static image analysis using a median (see Fig. 7).

Mathematical morphology is based on nonlinear operators working with the shape of an object. In the third part of preprocessing a sequence of mathematical morphological operations was used in this order: dilatation, open and erode (see Fig. 8).

Dilatation uses a structural element for expanding blood vessels in the image and fills the holes. Structural elements have a typical shape and size. Selected shapes are line, diamond, disk. These shapes were tested in the selection of the most appropriate choice of morphological element structures. The best results were obtained in the shape of a line.
Dilatation is defined as:
?? ⊕ ?? = {?? ∈ Ɛ2, ?? = ?? + ??, ?? ∈ ??, ?? ∈ ??} (1),
where X ⊕ B represents a point set of all existing vector sums for a pair of pixels, one belonging to the set X (native image) and one belonging to set B (structural element).
Subsequently, morphological opening is used on the image. A structural element with a diamond shape was used for the morphological opening. The distance from the original structural element to the diamond point was subsequently changed. Images with low contrast require longer distances. The opening method is defined as:
?? ∘ ?? = (?? ⊖ ??) ⊕ ?? (2),
it is a morphological operation including erosion and subsequent dilatation with the same structural element.
The next step is the erosion operation that subtracts two point sets by a vector difference. There are other minor inequalities that lead to image erasure. Erosion can be described as:
?? ⊖ ?? = {?? ∈ Ɛ2, ?? + ?? ∈ ??, ∀?? ∈ ??} (3),
where p is the pixel, ↋2 is the binary image space, X represents the original image and B is the structural element. In erosion, the same structural element as in the previous morphological opening method was used.
Through this complete process, applying the aforementioned morphological operations, it is possible to extend and enhance the retinal blood vessels. This image preprocessing is suitable for subsequent image segmentation.
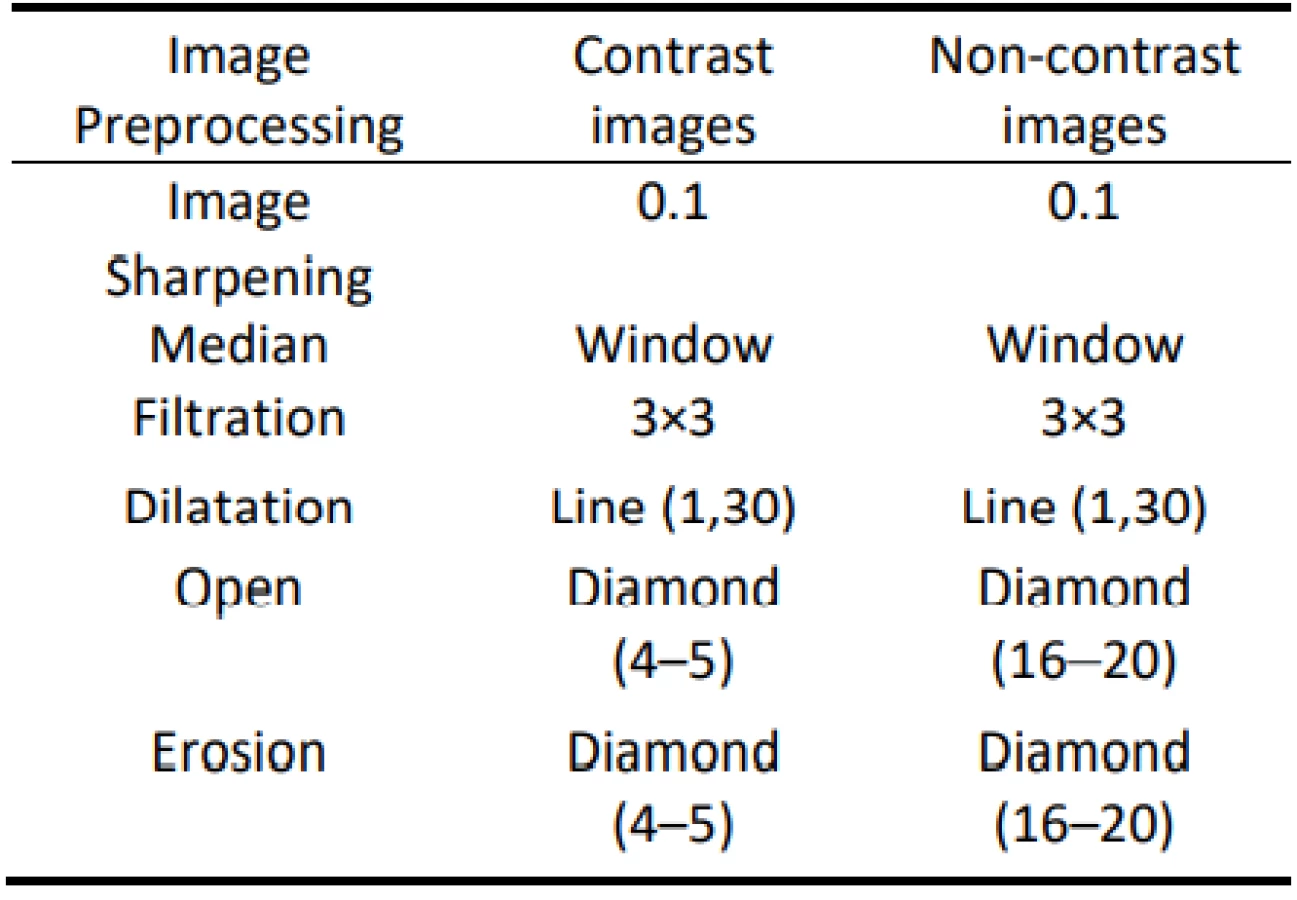
Table 4 shows the parameters for the optimal setting of preprocessing methods in different applications for contrast and non-contrast images. For image sharpening, the value strength of the sharpening effect was set to 0.1. It is a scalar value. The size of the filtration window was set to 3×3 in the median filter. Based on the testing results, it seemed best to use the structural element line for dilatation. This structural element is defined by the length of the line vector and degree of the line. A structural element with a diamond shape is suitable for the opening morphological operation with a radius size of 4–5 for a contrast image and 16–20 for a non-contrast image. The structural element was used in erosion, too.
Segmentation of Retinal Blood Vessels
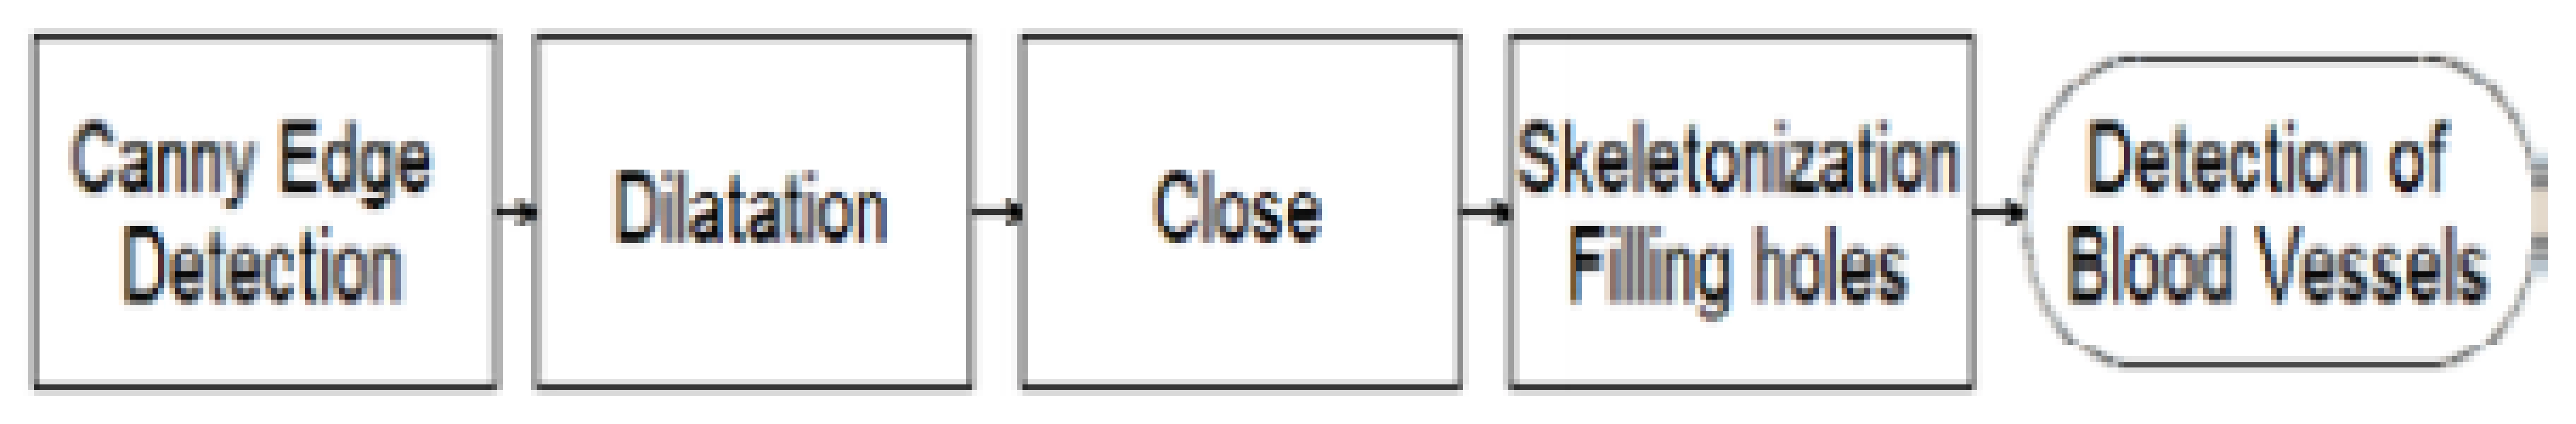
The whole segmentation process is shown in Fig. 9. The first step of image segmentation is edge detection based on a Canny operator. The detector monitors areas of pixels where brightness changes significantly. This operator finds the edges by looking for local maxima of the image gradient.
Canny’s edge detection showed better results than Sobel's operator because it is less susceptible to noise. Subsequently, thresholding was applied on the output image after Canny’s edge detection. Thresholding has the task of suppressing edges that are not in the center of interest. This is a simple method based on different levels (thresholds). Each pixel that is smaller than the level is defined as a background pixel, while the remaining pixels are determined to be pixels of the blood vessels. For lower contrast images, a lower threshold of 0.035–0.089 is required. For higher contrast images, the optimal threshold is in the range of 0.3–0.4.
Then dilatation is applied with a longer distance setting than in the previous preprocessing procedure. Morphological close was used in the next step. This operation represents dilation followed by a morphological erosion operation with the same structural element [13, 14].
The effect of these operations is the smoothing of the blood vessel contours, connection of narrow spaces and long narrow bay. Small holes can be removed, as well, and gaps in the contours are filled (see Fig. 10).

In the second step, binary skeletonization was implemented. This operation presents an operation which can eliminate information. The result of this method is the simplification of the objects in the image. The characteristic shape of the blood vessels is kept.
The output of the skeletonization algorithm is the skeleton (see Fig. 11a) [15, 16]. The final steps of the segmentation are filling holes and gaps in the segmented vascular system (see Fig. 11b).

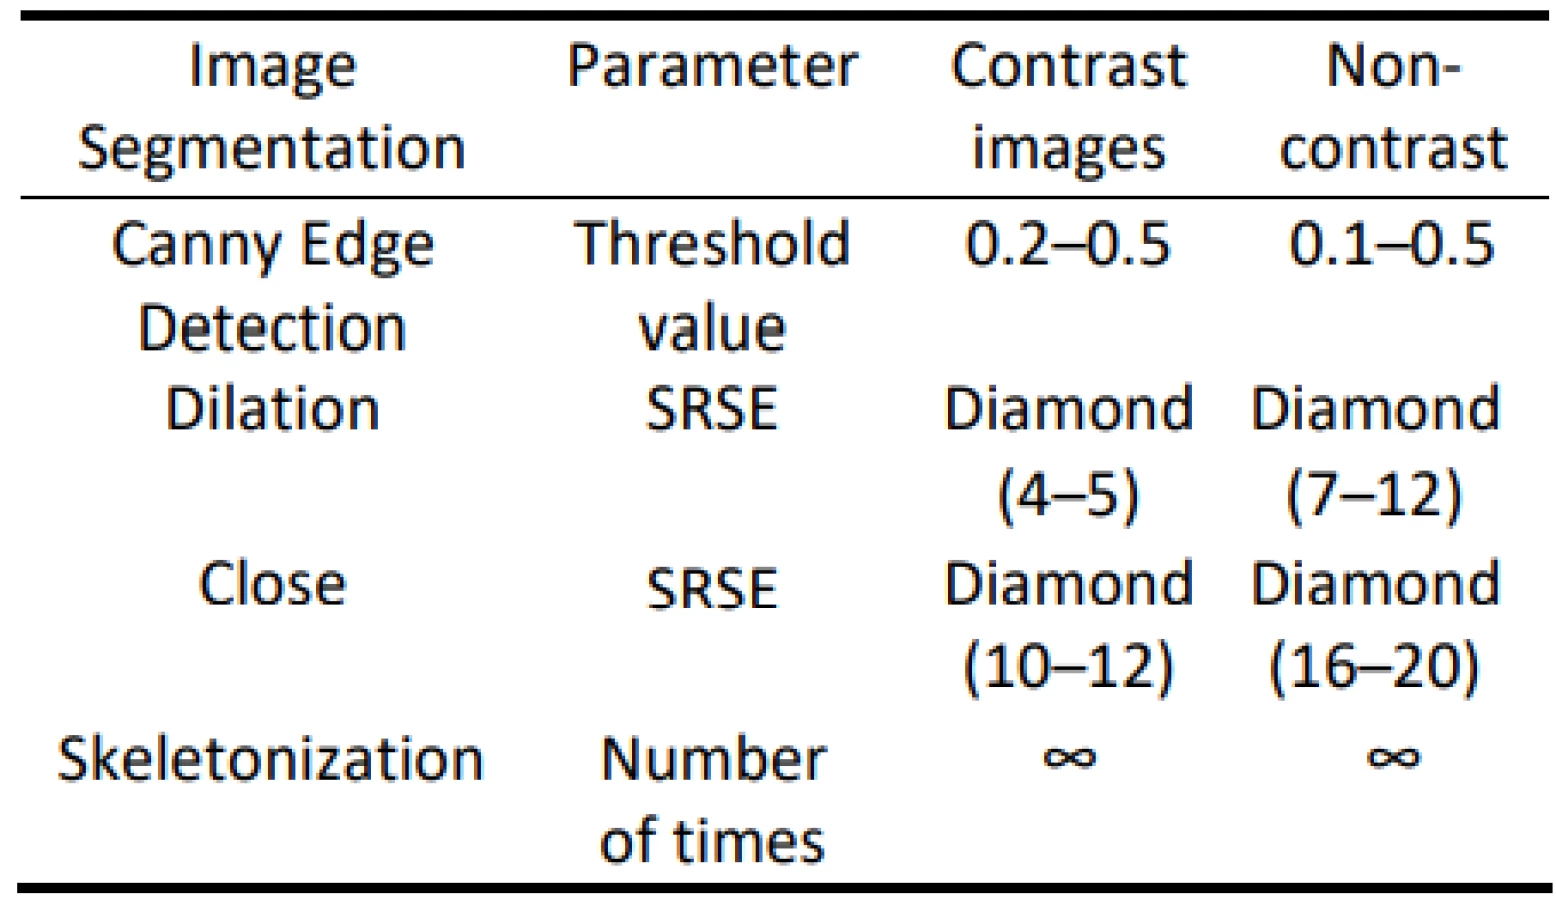
Table 5 shows the setting parameters for image segmentation. The threshold value changes in the Canny Edge detector. The diamond shape of the structural element is suitable for dilatation and close. The radius of the structural element was changing in the segmentation algorithm. The structural element diamond with a lower value is more suitable for a contrast image than a non-contrast image. Skeletonization is set to infinity because the operation repeats until the image no longer changes.
Proposed algorithm for calculation tortuosity
A segmented binary retinal blood vessel can be used in the algorithm for the calculation of a tortuosity symptom. Up to now, it has not been an objective parameter for evaluating the curving of the vascular system. So, after the application of our algorithm for calculating tortuosity, the tortuosity can be displayed with different curving using the threshold objectively.
Fig. 12 shows the design of the algorithm for the calculation curvature of segmented retinal blood vessels. First, it is necessary to transfer the segmented binary image into a sparse matrix, where zero elements are suppressed. Then the non-zero parts in the matrix were found, so information about the position of a point in the coordinates x, y is taken in this way.

To coordinate a system with x and y points, function f is represented as:
?? = ??(??) (4)
The gradients ??x, ??y are calculated from all coordinate points x, y. The gradient determines the slope of the tangent and the magnitude of the angle with the axis. The gradient calculation is based on the first derivative (see Fig.14).

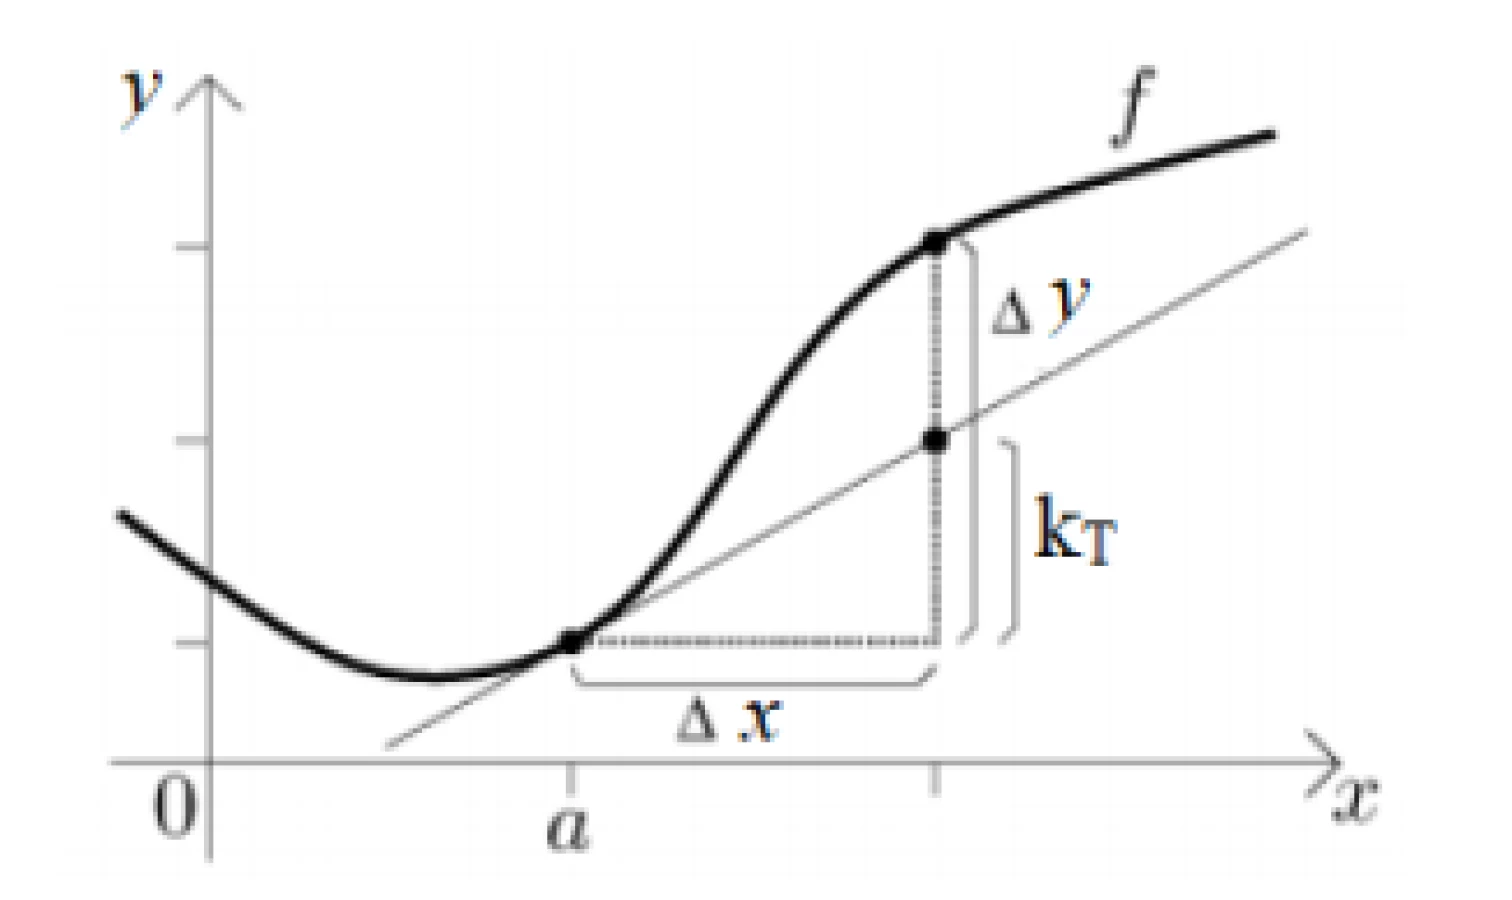
The first derivative is given by the following equation:

To determine the slope of curvature, we need to use tangent approximation at each point. The magnitude of the curvature is determined using the arctan cyclometric function of the ??x, ??y gradients. The resulting gradient represents the direction of the greatest slope in the function. This process can obtain the curvature value (BVC–Blood Vessel Curvature), which is based on the idea that the derivative determines the degree of the slope of the function.

Angles are calculated in each point of the blood vessels by the equation below:

Angles are computed in absolute values because we need to work with positive numbers. These angles can be used as an indicator of tortuosity. Afterwards a new matrix with information about the position of the angles is created. In the next step, the angles are selected and saved into a new variable based on the threshold setting by the user.
The red parts represent the areas of the retinal blood vessels with sizes above the selected threshold. Places which are below the selected threshold are displayed in a blue color (see Fig. 15).

The vascular system with evaluated tortuosity is rotated 90° to the left towards the vascular system. This rotation does not affect the result, it is only a certain feature of the algorithm. Rotation to the left can be easily deleted by adding a process to the algorithm for rotation of the image.
Verification of the proposed algorithm for evaluation of tortuosity from segmented image
The segmentation algorithm for the extraction of the retinal blood vessels was tested on images that were divided into two groups (15 contrasting images, 15 noncontrasting images). The retinal images were taken on left eyes and right eyes. The segmentation algorithm cannot be evaluated objectively, because we have not got any gold standard to which it could be related. The evaluation of the proposed segmentation method can be through visual comparison. From the images above (Fig. 14), it seems that the algorithm segmented the main arteries of the blood vessels of retinal images. Thus, the segmented images are suitable for testing the algorithm for the evaluation of tortuosity by threshold.
The proposed algorithm for the calculation of the curvature of retinal blood vessels was tested on these segmented images. The maximum and minimum of the tortuosity size were found from the image. The lowest degree of curvature is equal to zero while the highest degree of curvature is 135.
When the threshold is changed from a lower to higher value, the number of red markers decreases. These markers mean up-threshold values (Fig. 16).

In the next step, we tested images with different contrast. For all images, a threshold with a value of 30° was used. The algorithm marked places with a red color, which are above the threshold value in both of the image types.
If the algorithm works correctly, it is necessary to test images with different curvatures. In the images, blood vessels with a low curvature have fewer markers with steeper tortuosity. The threshold was set to the same value in the images. For this reason, the algorithm can be considered to be satisfactory. Images with a high curvature of blood vessels have more places with the red color (places above the threshold).
Discussion
One problem of images from RetCam3 is their low resolution; it has 640×480 pixels compared to images from the fundus camera with 1280×800 pixels.
In related works, one of the approaches was based on a series of morphological operations (close, dilatation and erosion) applied on data from the fundus camera. The method cannot be applied to our data in this order. The proposed algorithms for the segmentation of images from the fundus camera is not suitable for using data from RetCam3 (see Related Works chapter), because those two modalities are different. They have different resolutions, contrast, wide-field views. In our approach, it is necessary to preprocess the image to highlight a blood vessel map using G Channel extraction. It is the same as preprocessing an image from the fundus camera, but brightness transformation, image sharpening, histogram adaptation, median filter and morphological operations (dilatation, open, erode) are used in the next step. Preprocessing was the first part of the process for the segmentation of blood vessels. The algorithm was used to improve the observability of objects and enlarge the contrast of the vascular system against background.
Since tortuosity is not defined exactly by mathematical formulae or with parameters for measuring tortuosity, it is difficult to classify it precisely. Therefore, the next development of this application is in close cooperation with an ophthalmologist. It will be possible to define the golden standard for evaluation of the pathological and physiological tortuosity of vascular systems. The proposed algorithm is suitable for application data from the fundus camera with different setting parameters. From a clinical point of view from ophthalmology experts, this application showing places with curves is appropriate to help evaluate the tortuosity symptom. The application is a great benefit to clinical practice and suitable for further development and improvement.
Conclusion
An algorithm was proposed for the segmentation of retinal blood vessels from retinal images. Retinal images were taken by RetCam3 during medical checkups of newborns for the purpose monitoring the evolution of their retina. The segmentation method based on hybrid methods can segment the main blood vessels of retinal contrast and non-contrast images. The problem for premature babies is retinopathy of prematurity. This disease can lead to blindness. One of the symptoms is tortuosity, which represents the curving of the vascular system. No mathematically described objective parameter exists to evaluate the tortuosity. So, in this paper an algorithm is proposed for the segmentation of the binary vascular system through hybrid methods, after which the algorithm can be applied for the calculation of tortuosity.
To test the proposed algorithm, 30 images were chosen and divided into two groups for contrast and non-contrast images due to the visibility of the retinal blood vessels. It was found that this algorithm is suitable for the subsequent application of the tortuosity calculation. A binary image of the retinal blood vessels is the output of the image segmentation. This image is used in the algorithm to calculate tortuosity, which is based on a calculation of the gradient.
The results showed that the segmentation algorithm and algorithm for the calculation of the tortuosity work in both images (contrast and non-contrast) and images with different tortuosity. The places with the value of tortuosity above the threshold are indicated by a red color and below the threshold by a blue color.
The computational time of the segmentation algorithm depends on the image quality. The average computational time is 1 s. The computational time was tested on 30 images.
Acknowledgment
The work and the contributions were supported by the project SV450994 Biomedical Engineering Systems XV'. This study was also supported by the research project of The Czech Science Foundation (GACR)2017 No. 17-03037S Investment evaluation of medical device development at the Faculty of Informatics and Management, University of Hradec Kralove, Czech Republic. This study was supported by the research project The Czech Science Foundation (TACR) ETA No. TL01000302 Medical Device development as an effective investment for public and private entities.
Ing. Alice Krestanova
FEECS, K450
Faculty of Biomedical Engineering VSB–Technical University of Ostrava
17. listopadu 15, Ostrava-Poruba
E-mail: alice.krestanova@vsb.cz
Sources
- Relan D, Ballerini L, Trucco E, MacGillivray T. Retinal Vessel Classification Based on Maximization of Squared-Loss Mutual Information. Advances in Intelligent Systems and Computing. 2016 Oct 2;390 : 77–84. DOI: 10.1007/978-81-322-2625-3_7
- Sodi A, Mucciolo DP, Murro V, Zoppetti C, Terzuoli B, Mecocci A, Virgili G, Rizzo S. Computer-assisted evaluation of retinal vessel diameter in retinitis pigmentosa. Ophthalmic Research. 2016;56(3):139–44. DOI: 10.1159/000446843
- Patwari MB, Manza RR, Rajput YM, Saswade M, Deshpande N. Automatic Detection of Retinal Venous Beading and Tortuosity by using Image Processing Techniques. IJCA Proceedings on National Conference on Recent Advances in Information Technology. 2014;2 : 203–7. DOI: 10.1109/ICICA.2014.51
- Pourezza HR, Pourezza M, Banaee T. Simple and efficient method to measure vessel tortuosity. ICCKE 2013. 2013;10 : 219–22. DOI: 10.1109/ICCKE.2013.6682815
- Poletti E, Florin D, Grisan E, Ruggeri A. Automatic vessel segmentation in wide-field retina images of infants with Retinopathy of Prematurity. 2011 Annual International Conference of the IEEE Engineering in Medicine and Biology Society. 2011;8 : 3954–7, DOI: 10.1109/IEMBS.2011.6090982
- Onkaew D, Turior R, Kondo T, Uyyanonvara B. Automatic extraction of retinal vessels based on gradient orientation analysis. Computer Science and Software Engineering (JCSSE), 2011 Eighth International Joint Conference on: Piscataway: IEEE. 2011;6(8):102–7. DOI: 10.1109/JCSSE.2011.5930102
- Taševský P, Kolář R. Segmentace cévního řečiště ve foto-grafiích sítnice s využitím 2d diskrétní vlnkové transformace. Elektrorevue. 2009;48;4.
- Abbadi NK, Saadi EH. Automatic retinal vessel tortuosity measurement. Journal of Computer Science. 2013;9(11):1456–60. DOI: 10.3844/jcssp.2013.1456.1460
- Dougherty G, Johnson MJ, Wiers MD. Measurement of retinal vascular tortuosity and its application to retinal pathologies. Medical & Biological Engineering & Computing. 2010;48 : 87–95. DOI: 10.1007/s11517-009-0559-4
- Sil Kar S, Maity SP. Retinal blood vessel extraction using tunable bandpass filter and fuzzy conditional entropy. Computer Methods and Programs in Biomedicine. 2016;133 : 111–32. DOI: 10.1016/j.cmpb.2016.05.015
- Turior R, Chutinantvarodom P, Uyyanonvara B. Automatic tortuosity classification using machine learning approach. Applied Mechanics and Materials. 2012;241-244 : 3143–7. DOI: 10.4028/www.scientific.net/AMM.241-244.3143
- Sulik L, Krejcar O, Selamat A, Mashinchi R, Kuca K. Determining of blood artefacts in endoscopic images using a software analysis. Computational Collective Intelligence. 2015;9330 : 388–97. DOI: 10.1007/978-3-319-24306-1_38
- Cheng CS, Lee YF, Ong Ch, Yap C, Tsai ZL, Mohla A, Nongpiur ME, Aung T, Perera SA. Inter-eye comparison of retinal oximetry and vessel caliber between eyes with asymmet-rical glaucoma severity in different glaucoma subtypes. Clinical Ophthalmology. 2016;10 : 1315–21. DOI: 10.2147/OPTH.S96529
- Dziubek A, Guidobon G, Harris A, Hirani AN, Rusjan E, Thistleton W. Effect of ocular shape and vascular geometry on retinal hemodynamics: a computational model. Biomechanics and Modeling in Mechanobiology. 2016;15(4):893–907. DOI: 10.1007/s10237-015-0731-8
- Zhang S, She L, Ge X. Enhancement algorithms of retinal blood vessels based on curvelet conversion. Dongbei Daxue Xuebao/Journal of Northeastern University. 2016;37(7):922–6. DOI: 10.3969/j.issn.1005-3026.2016.07.003
- Blahuta J, Soukup T, Jelinkova M, Bartova P, Cermak P, Herzig R, Skoloudik D. A new program for highly reproducible automatic evaluation of the substantia nigra from transcranial sonographic images. Biomedical Papers. 2014;158 : 621–7. DOI: 10.5507/bp.2013.029
Labels
BiomedicineArticle was published in
The Clinician and Technology Journal

2020 Issue 2
Most read in this issue
- THE EFFECT OF FOOTWEAR TO THE POSTURE
- THE CHANGE OF CARDIOSTIMULATION DEVICE PROGRAMMING DUE TO DETECTION OF ELECTROMAGNETIC INTERFERENCE
- PREMATURE INFANT BLOOD VESSEL SEGMENTATION OF RETINAL IMAGES BASED ON HYBRID METHOD FOR THE DETERMINATION OF TORTUOSITY
- INAPPROPRIATE S-ICD PATIENT RECEIVES FALSE POSITIVE SHOCKS