
EFFECT OF SAMPLING RATE ON THE ACCURACY OF MEASUREMENT OF NEONATAL OXYGEN SATURATION EXPOSURE
Authors:
Thomas E. Bachman; Karel Roubík
Authors‘ workplace:
Czech Technical University in Prague, Kladno, Czech Republic
; Department of Biomedical Technology, Faculty of Biomedical Engineering
Published in:
Lékař a technika - Clinician and Technology No. 3, 2018, 48, 103-100
Category:
Overview
Patient data management systems are becoming commonplace in the ICU. While their intent is to automate patient charting, they provide a readily accessible, large database that would be potentially useful for clinical research and quality improvement projects. We sought to determine if patient data management information could be of value describing neonatal oxygenation saturation exposure (percent time in oxemic-ranges). Our primary measure was the accuracy of 60-second sampling over a 24-hour period, as compared to previously reported results in 23 infants. We found this to be highly accurate. We also conducted a sensitivity analysis using 3 other sampling rates (20, 30, 120 seconds) and 3 other time epochs (4, 12 and 48 hours). We found that sampling frequency and time epoch length impacted accuracy. Nevertheless these combinations could all be useful, if limitations are taken into account in the analysis design.
Keywords:
oxygen saturation, neonatal, database mining
Background
Patient data management systems (PDMS) are becoming commonplace in large medical centers. They integrate ongoing vital sign status from patient monitors with lab results and details of important therapeutic interventions such as infusion and respiratory support. Their primary aim is to provide accurate automated patient charting for medical records. However they also provide a database potentially useful for quality improvement and clinical research projects.
Oxygenation saturation exposure has been shown to dramatically impact outcomes in the neonatal ICU [1]. Most baseline validation studies of neonatal SpO2 control have collected data every 5 seconds [2]. On the other hand, PDMS collection of data for patient charting varies but is often every 60 seconds. Nevertheless, such PDMS data have been used to evaluate the impact of changes in practice on neonatal oxygenation in the ICU [3–5].
The theoretical impact of sampling rate can be deter-mined mathematically, but is only precise for periodic patterns that are also uniform over the time epoch. Most physiological variables do not meet these criteria; certainly not the SpO2 levels of acutely ill neonates. One study did determine the impact of SpO2 averaging time on characterization of individual desaturation episodes [6], but we are unaware of any studies evaluating the impact of sampling rate on the accuracy of aggregated oxygen saturation exposure.
We have access to a database of SpO2 data collected every 5 seconds from published evaluations of FiO2‑SpO2 automated control systems in the NICU. Our aim in this investigation was to determine the impact of sampling rate on the accuracy of oxygenation exposure to provide guidance on the limitations of using PDMS data for Quality Improvement and research projects.
Methods
We selected 23 typical cases from two neonatal studies in our database [7, 8]. Each included 48 hours of data with SpO2 collected every 5 seconds. Care was taken to include a wide range of infant-stabilities based on percent time in the SpO2 normal range.
We hypothesized that sufficient accuracy would be achieved with a 60 second sample rate for an obser-vation epoch of 24 hours. In light of the differences reported in various SpO2 control studies, and the accu-racy of SpO2 measurement [9], we assumed an accuracy of 1 %-time would be acceptable. For purposes of evalu-ating sensitivity, we also considered faster and slower sample rates as well as shorter and longer time epochs.
Rather than evaluating the accuracy across the entire range we selected 3 specific clinically relevant end-points, %-time in hypoxemia, normoxemia and hyperoxemia. These oxemic-ranges were defined as SpO2: ≤80%, 87–96% and 98–100%, respectively. We sampled the SpO2 data at precise intervals of 20, 30, 60 and 120 seconds. We also evaluated SpO2 monitoring epochs of 4, 12, 24 and 48 hours. We calculated the %‑time for each of the three oxemic ranges for each of the conditions. For each we determined the difference in %-time as compared to the 5-second data.
Precision was defined as the absolute value of the differences, and bias as the mean of the differences. In total there were 16 cases (each of the 4 evaluation time epochs, each of the 4 sampling rates). We chose to define accuracy as the square root of the sum of the mean of the squares of precision and bias. We also calculated the 95% confidence limits of each summary mean, based on the variation between subjects to provide a measure of uncertainty. Accuracy, bias and precision were all presented as absolute %-time units, not as percent of reading.
Data was sampled and summarized using MatLab (vR2015a, MathWorks). The data were tabulated, charted and analyzed using Excel (v14.7.2, Microsoft) and XLSTAT (v19.02, Addinsoft). For purposes of comparison, measurements were considered statistically significantly different if the 95% confidence limits did not overlap.
Results
A histogram of the aggregate SpO2 exposure for the 23 subjects is shown in Figure 1. The median and range of the %-time in the 3 oxemic-ranges for these subjects were: hypoxemia (4.0%, 0.6%–9.7%), normoxemia (62%, 41%–93%) and hyperoxemia (5.3%, 0.1%–27%).

The precision, bias and accuracy of the primary parameters (sample rate of 60 seconds and epoch length of 24 hours) are shown in Table 1a. The accuracy in all 3 oxemic-ranges is excellent: (hypoxemia 0.4 %-time, normoxemia 1.0 %-time and hyperoxemia 0.3 %-time). The accuracy of normoxemia was statistically signify-cantly larger than the hypoxemia and hyperoxemia accuracy. Not different among the oxemic-ranges, the bias was also minimal as shown. Thus the accuracy was primarily impacted by the precision, and not a system-atic sampling bias.
![a: Precision, Bias and Accuracy for 60-second.
Sampling and 24-hour Epoch [mean (95% CI)].](https://pl-master.mdcdn.cz/media/cache/media_object_image_large/media/image_pdf/3b31c6776bd44abbd2ead3f7677574ab.png)
The accuracy for the 60-second sampling rate for the 3 other epochs (4, 12, 48 hours) is shown in Table 1b. As would be expected the data show a trend of the accuracy decreasing as the epoch is shortened. Illustra-tive of this, for normoxemia the accuracy ranges between 0.8% for 48-hour epoch and 2.9% for a 4-hour epoch.
![Table 1b: Accuracy for 60-second. Sampling for
48-hour, 12-hour and 4-hour Epochs [mean (95% CI)].](https://pl-master.mdcdn.cz/media/image_pdf/f61679e1476e317037eb881c5d228e9e.png?version=1549658820)
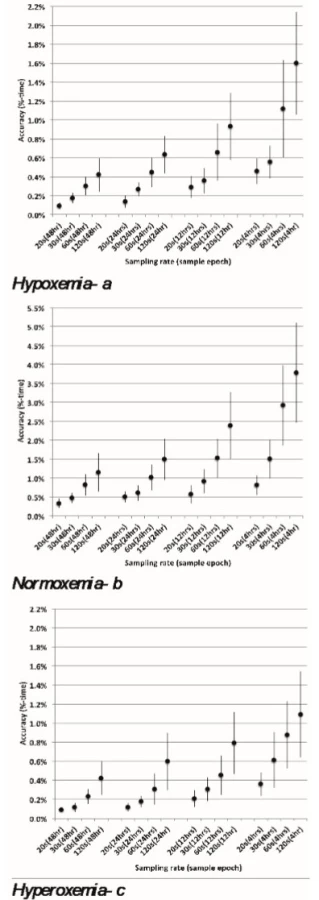
Figure 2abc show the accuracy of %-time, with 95% confidence limits, for all 16 combinations of sampling rate and epoch length. The accuracy tends to improve proportionately with an increase in sampling rate. As an example, for the 4-hour epoch, the accuracy of normoxemia is 3.8 %-time for 120-second sampling rate, 2.9 %-time for 60-second sampling, 1.5 %-time for a 30-second sampling and 0.8 %-time for a 20‑second sampling (Figure 2b).
Though evident in Figures 2abc, as detailed in Table 2, even the 120-second sampling rate is suitable (approximately 1% accuracy) for assessing longer time epochs.

Discussion
We evaluated the impact on the accuracy of %-time in clinically relevant oxemic ranges associated with changes in sampling rate and also duration of endpoint epoch. We confirmed our hypothesis that 60 second sampling was accurate. We found different sampling rates suitable for many uses, but identified some limitations. Two anticipated trends were apparent. For each of the three-oxemia categories the accuracy was worse with both slower sampling rates and shorter epochs. We also found the accuracy was different for three oxemic-ranges.
We speculated that the impact of the sampling rate on accuracy might differ with different oxemic endpoints. Hypoxemia exposure is characterized by precipitous desaturations of varying lengths followed by quick recovery associated with an intervention or recovery from disordered breathing. In contrast hyperoxemic exposure is usually caused by failure to wean inspired oxygen with episodes perhaps less precipitous and of longer duration. Finally we would expect that periods of normoxemia would be characterized by longer duration. There was a trend for the accuracy for hyperoxemia to be slightly better than during hypoxemia, but the difference is small and certainly not relevant. In contrast the accuracy during normoxemia was markedly worse than either. We note, however, that the median values for the three exposure endpoints were 5 %-time (hyperoxemia), 4 %-time (hypoxemia) and 63 %-time (normoxemia). Considering the difference in scale, the accuracy as a percent of reading was actually much better during normoxemia, so that these relative differences in absolute accuracy are probably not relevant.
We offer several sources of data suggesting anticipated differences in SpO2 that might be expected in research or quality improvement. A meta analysis of 10 studies comparing automated to manual control of FiO2 reported an aggregate difference in the percent time in the intended SpO2 range of 12 %-time (range among studies 4–35) and in severe hypoxemia of 1 %‑time (range among studies (less tha1–2)) [2]. One center published the results of three changes in practice [3–5]. They reported differences in the percent time in the intended SpO2 range between 12–14 %-time, in severe hypoxemia between less than 1–3 %-time and in hyperoxemia between 3–8 %-time. Finally several studies have reported the difference in the percent time in the intended SpO2 range among automated control with different settings of 0–2 %-time [8, 10–11]. These provide a reasonable perspective of what size changes might be expected with a change in practice.
Unfortunately an understanding of what magnitude of change in exposure to SpO2 extremes might effect clinical outcomes is very limited. In a landmark trial
of high and lowered SpO2 targets an increase in hyperoxemia from less than 10 to 25 %-time was associated with an increase in severe pulmonary and retinal morbidity [12]. A recent analysis of the impact of exposure to severe hypoxemia in a large group of extremely preterm infants reported an increase in late death or disability associated with increasing percent time with SpO2 less than 80%. They found a decrease in this composite outcome of nearly 50% associated with an decrease of exposure from more than 10 to less than 1 %-time [13]. These provide a range of change of exposure to SpO2 extremes associated with significant changes in outcome. Smaller incremental changes might reasonably be expected to be associated with smaller incremental changes in outcome that would be relevant. We suggest that a 2 %-time change might be clinically relevant for hypoxemia, and something larger for hyperoxemia.
In the prospective planning of an analysis of oxygenation exposure using PDMS data one must consider the measurement variability as well as the desired detectable clinically relevant change in order to determine the necessary sample size (i.e., number of subjects). As an illustration, consider comparing the exposure to hypoxemia between the morning and evening 12-hour shifts. Accepting that a difference of 2 %-time was clinically relevant, and using the standard deviation we found as the variability, we calculated the number of subjects needed. Based on a standard power calculations, there would be an 80% chance of detecting a 2 %-time difference in the time in hypoxemia at the p<0.05 level of certainty with a comparison of 27 subjects with 60-second sampling and 68 subjects with 120-second sampling. In contrast it would be unreason-able to expect that an observed 2 %-time difference would be reliable when looking at one patient’s morning-evening difference in one day. Nevertheless, the difference associated with a marked change on outcome (e.g., 1 to 10 %-time) would be reliable.
Our analysis has some limitations. First, while the trends among sample rates and epoch lengths that we explored in the sensitivity analyses were every consistent, only some reached statistical significance. Nevertheless this is markedly less than the clinical accuracy of the pulse oximeter [9]. Second, while our sample of subjects was diverse, the number of subjects made it impossible to explore subgroup analyses based on the extremes of exposure. Both would require analysis of a larger sample of cases. Further other metrics of accuracy such as Bland-Altman or regression might have provided a different perspective. Finally it should also be noted that using data from a PDMS, at any nominal sampling frequency, is unable to capture the prevalence of infrequent prolonged episodes of oxygenation extremes, or swings between extremes that might also impact outcome.
Conclusion
Our analysis shows that using SpO2 data from a PDMS for evaluation of oxygenation exposure with a sampling period of 60 seconds is reliable. It also suggests that faster sampling rates would permit reliable analysis within smaller numbers of subjects or shorter exposure periods and that even 120-second sampling would be useful for some evaluations. Finally we encourage centers with access to this kind of data to use it to explore the association of SpO2 extremes with not only better care practices but also improved outcomes.
Acknowledgement
The work was supported by grant SGS17/203/OHK4/3T/17 of the Czech Technical University in Prague.
Thomas E. Bachman MSc.
Department of Biomedical Technology
Faculty of Biomedical Engineering
Czech Technical University in Prague
nám. Sítná 3105, CZ-272 01 Kladno
&
Economedtrx
Lake Arrowhead, CA USA 92352-1269
E-mail: tbachman@me.com
Phone: +1 909 337-0828
Sources
-
Askie, L. M., Darlow, B. A., Finer, N., et al.: Association between oxygen saturation targeting and death or disability in extremely preterm infants in the Neonatal Oxygenation Prospective Meta-analysis Collaboration. JAMA 2018;319(21), 2190-201.
-
Mitra, S., Singh, B., El-Naggar, W., McMillan, D. D.: Automated versus manual control of inspired oxygen to target oxygen saturation in preterm infants: a systematic review and meta analysis. J Peri 2018; 38, 351-60.
-
Van Zanten, H. A., Becks, E. C., Stenson, B. J., et al.: Improving manual control of oxygen titration in pteterm infants by training and guideline implementation. EJ Pediatr 2017; 176(1), 99–107.
-
Van Zanten, H. A., Kuypers, K. L. A. M., Stenson, B. J., et al.: Effect of a smaller target range on the compliance in targeting and distribution of oxygen saturation in preterm infants. Arch Dis Child Fetal Neonatal Ed, 2018; 103(3), F430–435.
-
Van Zanten, H. A., Pauws, S. C., Stenson, B. J., et al.: The effect of implementing an automated oxygen control on oxygen saturation in preterm infants. Arch Dis Child Fetal Neonatal Ed 2017; 102(5), F395–F399.
-
Vagedes, J., Bialkowski, A., Wiechers, C., et al. A conversion formula for comparing pulse oximeter desaturation rates obtained with different averaging times. PLoS ONE 2014; 9(1): e87280.
-
Warakomska, M., Bachman, T. E., Wilinska, M.: Randomized evaluation of two SpO2 alarm strategies during automated FiO2 control in the NICU. PAS 2018.
-
van den Heuvel, M. E., van Zanten, H. A., Bachman, T. E., et al.: Optimal target range of closed-loop inspired oxygen support in preterm infants: a randomized controlled study. JPediatr 2018; 197, 36–41.
-
Ross, P. A., Newth, C. J. L., Khemani, R. G.: Accuracy of pulse oximetry in children. Pediatr 2014; 13 (1) 22–29.
-
Wilinska, M., Bachman, T. E., Swietlinski, J., et al.: Automated FiO2-SpO2 control system in neonates requiring respiratory support: a comparison of a standard to a narrow SpO2 control range. BMC Pediatr 2014; 14(130), 1–5.
-
van Kaam, A. H., Hummler, H. D., Wilinska, M., et al.: Auto-mated versus manual oxygen control with different saturation targets and modes of respiratory support in preterm infants. J Pediatr 2015; 167(3):5435-50.
-
Askie, L. M., Henderson-Smart, D. J., Irwig, L., Simpson, J. M.: Oxygen-Saturation targets and outcomes in extremely preterm infants. N Engl J Med 2003; 349 : 959-67.
-
Poets, C. F., Roberts, R. S., Schmidt, B., et al: Association between intermittent hypoxemia or bradycardia and late death or disability in extremely preterm infants. JAMA. 2015; 314(6):
595–603.
Labels
BiomedicineArticle was published in
The Clinician and Technology Journal

2018 Issue 3
Most read in this issue
- EEG MICROSTATES ANALYSIS IN PATIENTS WITH EPILEPSY
- EFFECT OF SAMPLING RATE ON THE ACCURACY OF MEASUREMENT OF NEONATAL OXYGEN SATURATION EXPOSURE
- BIPHASIC CALCIUM PHOSPHATE SCAFFOLDS DERIVED FROM HYDROTHERMALLY SYNTHESIZED POWDERS
- FLEXIBLE TEG ON THE ANKLE FOR MEASURING THE POWER GENERATED WHILE PERFORMING ACTIVITIES OF DAILY LIVING