
Diagnostic accuracy of the R-Factor in differentiating between neonatal hepatitis and biliary atresia in infants
Authors:
S. M. Dehghani 1; S. Mohammadi 1; I. Shahramian 2; F. Parooie 2; H. Mirzaie 2; M. Salarzaei 2
Authors‘ workplace:
Gastroenterohepatology Research Center, Shiraz, Iran
1; Pediatric Gastroenterology and Hepatology Research Center, Zabol University of Medical Sciences, Zabol, Iran
2
Published in:
Gastroent Hepatol 2021; 75(2): 143-148
Category:
Hepatology: Rewiev Article
doi:
https://doi.org/10.48095/ccgh2021143
Overview
Introduction: Liver function test is a part of safe and affordable routine blood biochemical tests and provides useful information for the diagnosis and management of liver dysfunction. In this study we evaluated the value of the R factor in distinguishing between intrahepatic and extrahepatic causes of infant cholestasis. Methods: Receiver operating characteristic (ROC) analysis was performed to evaluate the diagnostic value of the R factor in each group in comparison with liver biopsy as the gold standard of diagnosis. The data were analyzed using SPSS statistical software and P < 0.05 indicated a significant difference. Results: The study included 37 neonatal hepatitis patients (group A) and 25 biliary atresia patients (group B). The R factor was calculated using the (ALT patient/ ULN) / (ALP patient/ ULN) formula; ROC analysis revealed that if the R factor was ≤ 0.09 the patient diagnosis would be biliary atresia with high sensitivity (92%) (p-value = 0.001). The corresponding specificity, positive predictive value (PPV), negative predictive value (NPV), diagnostic accuracy and area under the ROC curve (AUC) were 75.7%, 72%, 93%, 82% and 0.87, respectively. Conclusion: The study revealed that the R factor is a good diagnostic marker for differentiating between the most common intrahepatic and extrahepatic causes of infant cholestasis and has good diagnostic accuracy, sensitivity, specificity, PPV and NPV, in comparison with liver biopsy as the gold standard of diagnosis.
Keywords:
intrahepatic cholestasis – extrahepatic cholestasis – R factor
Introduction
Neonatal cholestasis is caused by a disorder that may result from bile production deficiency of the liver cells, membrane transportation defect, or mechanical obstruction of the bile duct and the accumulation of its substances in the serum [1]. This disease is often associated with the clinical manifestation of long-term jaundice (icterus). The most obvious paraclinical symptom of cholestasis is increased direct (conjugated) bilirubin [2]. Whenever the conjugated bilirubin of the serum is more than 1mg/ dl (in cases where the total bilirubin is less than 5) and more than 20% of the total bilirubin (in cases where the total bilirubin is more than 5), cholestasis occurs [3]. The most important action in dealing with cholestasis patients is differentiating between extrahepatic causes (biliary atresia, choledochal cyst, stenosis at the bile duct, mucous tampon) and intrahepatic causes (neonatal hepatitis and other causes). Moreover, the other critical action that must be taken to deal with this disease is not only the diagnosis of medical curable diseases such as galactosemia, hypothyroidism, tyrosinemia, panhypopituitarism, and infectious diseases (like sepsis) as well as the early diagnosis of biliary atresia for treatment with kasai surgery [4]. Kasai surgery is the replacement of the gall bladder and the blocked bile ducts thereof with a segment of the patients’ intestine. A liver function test (LFT) is one of the biochemical blood tests providing valuable information for the diagnosis and follow-up of liver diseases [5]. The ALT/ ALP ratio (R factor) has been defined by the International Committee of Medical Sciences in the World Health Organization (WHO) for differentiating between different kinds of acute drug-induced injuries. In this definition, if the ALT value is twice its normal value or we have an R factor ≥5, the hepatic injury will be a hepatocyte/ cellular injury. However, if the ALP value is twice its normal value and we have an R factor ≤2, the injury will be cholestatic. When the ALT and ALP were both above their normal values and we had 2< R <5, both kinds of injuries (i.e. hepatocyte and cholestatic injuries [6]) were present. Thus, in the present study, given this definition of the International Committee, attempts were made to compare the R factor or ALT/ ALP ratio in cholestasis patients with intrahepatic and extrahepatic causes. Moreover, attempts were made to investigate the accuracy, sensitivity, specificity, positive predictive value (PPV), and negative predictive value (NVP) of this method in comparison with a liver biopsy (as the gold standard for the diagnosis of these two diseases).
Method
The present study was a retrospective study conducted on 62 infants less than 3 months old with cholestasis, hospitalized at the Pediatric Gastroenterology Ward of Namazi Hospital in Shiraz from March 2014 to March 2018. The patients were included if they first presented with cholestasis and their diagnosis was not considered in the selection process. However, the final diagnosis of these patients was either neonatal hepatitis or biliary atresia as the prototypes of cholestasis with intrahepatic and extrahepatic causes, respectively. They were excluded if they presented a history of musculoskeletal or cardiac disorders. The medical history of the patients was obtained, and a complete examination was conducted as well. The examination included the age of jaundice onset, birth weight, stool color, symptoms of systemic diseases, ophthalmologic investigations, rectal examinations, organomegaly, and growth status investigation. At this center, the paraclinical examinations routinely conducted on all infants with cholestasis included CBC, urinalysis, urine-reducing substances, thyroid function tests, bacterial cultures of both the urine and the blood, serum alpha-1-antitrypsin phenotyping, serum succinyl acetone, screening for cystic fibrosis (sweat chloride test), acid-base status, serum alanine aminotransferase (ALT), aspartate aminotransferase (AST), alkaline phosphatase (ALP), gamma-glutamyl transpeptidase (GGT), PT, PTT.INR, and serum albumin.
The present study was conducted on the basis of the information available on the patients’ records, and no extra laboratory or paraclinical costs were incurred. Having explained the study, the researchers obtained an informed letter of consent from the patient’s parent. As many as 62 patients entered the present study; 37 with a final diagnosis of neonatal hepatitis, and 25 with biliary atresia. The final diagnoses were confirmed by liver biopsy and histopathology results and, if needed, intraoperative cholangiography. These two groups were compared in terms of different variables, the most important of which was the R factor (ALT/ ALP ratio). Other variables included the information related to age, gender, birth weight, present weight, the onset time of cholestasis symptoms, the symptoms related to the disease at the onset, diagnosis type based on the patients’ laboratory parameters including liver function tests, diagnosis type based on ultrasonography criteria (according to ultrasonography, there are diagnostic criteria merely for diagnosing biliary atresia), and diagnosis type based on the histopathology results. The questionnaire contained demographic-clinical information as well as the patients’ test results. The data obtained were analyzed using SPSS. The data normality was investigated using the K-S test. Moreover, the chi-squared test, T-test, and Mann-Whitney test were applied as well. When the quantitative data were normal, the T-test was applied, and when they were not normal, the Mann-Whitney test was applied. In some cases, Fisher’s Exact Tests were applied as well. A p-value < 0.05 was determined to be statistically significant. When the quantitative data were normal, the T-test was applied, and when they were not normal, the Mann-Whitney test was applied.
Results
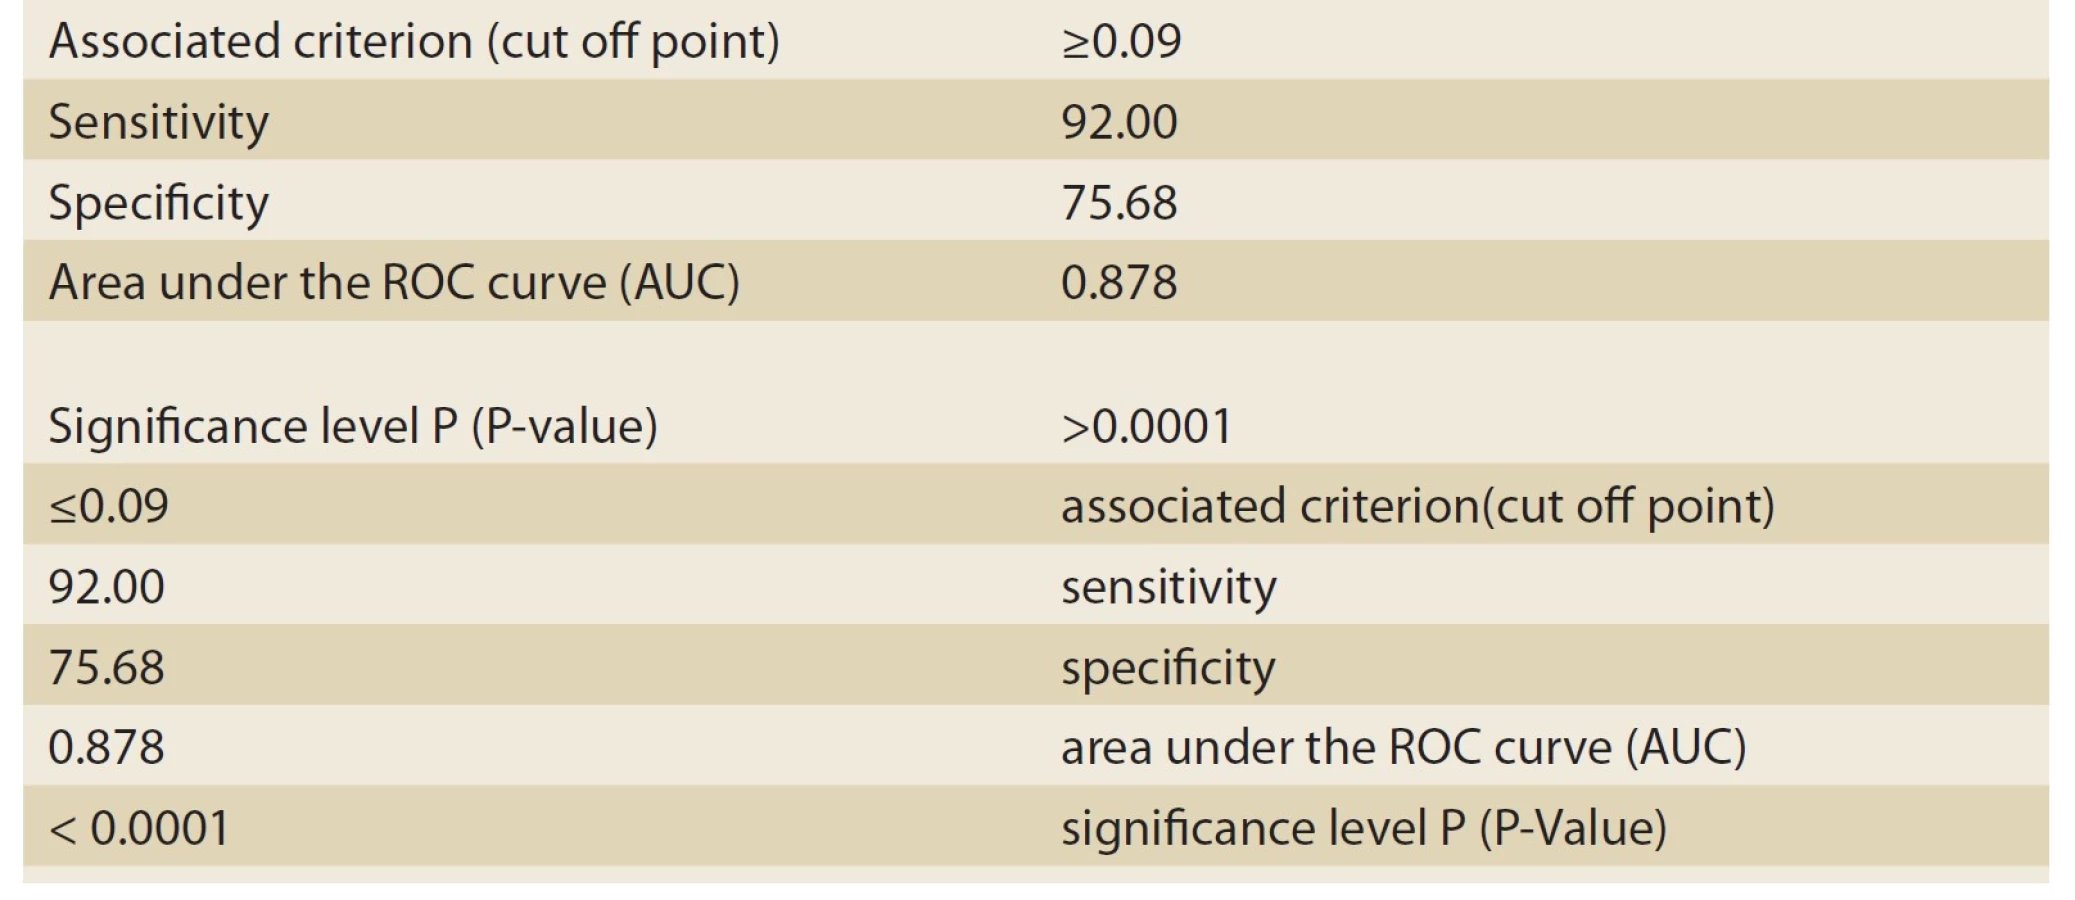
Based on histopathologic findings, the patients were divided into two groups: cholestasis patients with intrahepatic causes of neonatal hepatitis (Group 1), and cholestasis patients with extrahepatic causes of biliary atresia (Group 2). As many as 37 patients constituted Group 1 (neonatal hepatitis or NH), and 25 patients constituted group 2 (biliary atresia or BA). Of the 37 patients in Group 1, 16 patients (43.2%) were male, and 21 patients (56.8%) were female. Moreover, of the 25 patients in Group 2, 12 patients (48%) were male, and 13 (52%) were female. The mean age at onset was 45 ± 30 days in the NH group and 34±26 days in the BA group. The most important variable investigated in these two groups was the ALT/ ALP ratio or the R factor. The numerical mean of the R factor was 0.21 ± 0.18 in the NH group and 0.05 ± 0.02 in the BA group; this difference was highly significant (P-value <0.001). For differentiating between the NH and BA groups, the sensitivity and specificity of the R factor were evaluated by MedCalc-8. The number suggested by MedCalc-8 as the cutoff point is 0.09 for differentiating between the two groups. In other words, 0.09 was the point that had the highest sensitivity for the diagnosis of the BA group (given the remarkable significance of the earlier diagnosis of BA patients and the medical treatment and faster surgery for maintaining a better prognosis). Moreover, if the R factor was ≤0.09, as can be seen in Tab. 1 and the ROC Curve graph (Graph 1), with a sensitivity of 92% and a specificity of 75.68%, it could be stated that the patient suffered from BA. This point had the highest sensitivity (having an acceptable specificity) for the diagnosis of BA. Moreover, the positive predictive value (PPV) of this test was 72% for these patients. The negative predictive value (NPV) and accuracy were 93% and 82%, respectively. If the R factor was >0.09, a patient with a sensitivity of 75.8% and a specificity of 92% suffered from NH (Tab. 2, Graph 2).
Tab. 1. Informace související s grafem ROC Curve analyzované MedCalc-8
(pacienti s biliární atrezií).
Tab. 2. Informace související s grafem ROC Curve analyzovaným MedCalc-8
(pacienti s neonatální hepatitidou).

Graf 1. Graf ROC křivky analyzovaný MedCalc-8
(pacienti s biliární atrezií).

Graf 2. Graf ROC křivky analyzovaný MedCalc-8
(pacienti s neonatální hepatitidou).

Tab. 3. Mezní bod a 0,09 kritérium pro R-faktor.

Tab. 4. Paraklinické srovnání skupiny pro neonatální hepatitidu a skupiny biliární
atrezie.

The PPV of this test was 93% for NH patients and the NPV was 72% in these cases. The accuracy of this test for NH was 82%. Since there was no healthy group in the present study, and the comparison was made between two groups of patients, in the statistical graph and analysis, the sensitivity of one group was equal to the other and vice versa. With this cutoff point (0.09) and R factor ≤0.09, as many as 23 patients in the BA group (out of 25 patients) were diagnosable (92%) (Tab. 3). As for the NH group, with the cutoff point (0.09) and R factor >0.09, as many as 28 patients of the NH group (out of 37 patients) were diagnosable (75.7%) (Tab. 3, 4). In other words, the sensitivity of this test was 92% for the BA group and 75.7% for the NH group. However, for comparing and investigating the NH and BA groups, other variables have been applied that are discussed in the following paragraphs.
In the present study, based on their birth weights, the patients were divided into three groups: patients with a birth weight of ≤1,500g as the first category; patients with a birth weight of 1,501–2,500g as the second category; and patients with a birth weight of >2,500g as the third category. Then, in each category, the NH patients were compared to those of the BA group. In the NH group, 2.7% of the patients weighed ≤1,500g, 40.5% of the patients weighed 1,500–2,500g, and 56.8% of them weighed >2,500g. As for the BA group, none of the patients weighed ≤1,500g, 12% of the patients weighed 1,500–2,500g, and 88% of them weighed >2,500g. Three patients (8.1%) from the NH group and 16 patients (64%) from the BA group had acholic stool; this difference was statistically significant (P-value <0.001). Moreover, as many as 8 patients (21.6%) from the NH group and 18 patients (72%) from the BA group had hepatomegaly; this difference was statistically significant (P-value <0.001). In addition, 8 patients (21.6%) from the NH group suffered from ascites, while none of the BA group’s patients suffered from ascites; this difference was statistically significant (P-value <0.017). In the present study, the clinical diagnosis before conducting a liver biopsy was investigated in both groups. Then, it was compared with the final diagnosis resulting from the liver biopsy and intraoperative cholangiography. The clinical diagnosis of 34 patients (91%) of the NH group and 20 patients (80%) of the BA group was consistent with the final diagnosis. The ultrasonographic diagnosis was consistent with the final diagnosis in 9 patients (36%) of the BA group. The paraclinical tests were completely evaluated and compared in both groups (Tab. 4).
Discussion
In the present study, by investigating the cholestasis patients, attempts were made to introduce a new, rapid, accessible method for differentiating between two groups of patients (BA and NH patients). As can be observed in the ROC Curve Graphs (Graphs 1, 2) and the tables for the information analysis of these graphs (Tab. 1–3), it can be concluded that the ALT/ ALP ratio or R factor with a sensitivity of 92% was capable of predicting and diagnosing BA patients (R factor ≤0.09). The specificity of this test for BA patients was 75.7% (P-value <0.001). Given the importance of early diagnosis in this disease, the test‘s sensitivity was of high significance. The significant sensitivity of this test, its PPV (72%), NPV (93%), and accuracy (82%) indicate the usefulness of this test as a reliable and valid method for diagnosing BA and differentiating it from NH. In their study, Yu et al indicated that the R factor increased significantly in the patients of the NH group [7]. Moreover, Dehghani et al. indicated that (in comparison with the NH group) in the BA group, AST, ALT, ALP, and GGT increased significantly [8]. In another study conducted by Rafeey et al, it has been indicated that the ALP and GGT levels of the BA group were significantly higher than those of the NH group [9]. Moreover, they have indicated that the sensitivity and specificity of GGT for the diagnosis of BA was 88.9% and 66.7%, respectively. However, in both of the aforementioned studies, no attempts were made to investigate the ALT/ ALP ratio. This ALT/ ALP ratio in NH patients (R factor >0.09) has an acceptable sensitivity (75.7%) and specificity (92%) (P-value <0.001). Moreover, the PPV (93%), NPV (72%), and accuracy (82%) of this test were highly significant for this group; it can be applied as a reliable method for differentiation between these two groups. Thus, it can be concluded that the diagnostic value of the R factor was completely obvious in differentiating between liver cholestasis with intrahepatic causes (in the present study, NH was used as the representative of this group) and extrahepatic causes (in the present study, BA was investigated). In addition, in cases where a liver biopsy is impossible for any reason, this simple and accessible test can be applied for differentiating between these two groups (until the biopsy conditions were provided), and this test can prevent wasting time in patient treatment, especially in BA patients; faster kasai surgery will result in a better prognosis [10]. In comparing the birth weight of the NH and BA groups, in the NH group 40.5% of the patients weighed 1,500–2,500 g, and 56.8% of them weighed >2,500 g. As for the BA group, 12% of the patients weighed 1,500–2,500 g, and 88% of them weighed >2,500 g. In a study conducted by Mowat et al, it was observed that 35% of the patients in the NH group weighed 2,500 g and 22% of them were premature. As for the BA group, all the infants weighed more than 2,500 g [11]. Therefore, it can be concluded that the patients in the BA group have a better birth weight in comparison with the patients in the NH group (P-value <0.02). Three patients (8.1%) from the NH group and 16 patients (64%) from the BA group had acholic stool, and this difference was statistically significant (P-value <0.001). Abou-Taleb et al have reported that the existence of acholic stool was one of the main signs indicating BA [12]. As for hepatomegaly, it can be stated that as many as 8 patients (21.6%) from the NH group and 18 patients (72%) from the BA group had hepatomegaly; this difference was statistically significant (P-value <0.001) [13]. Thus, it can be concluded that there was a significant statistical difference between the groups in terms of acholic stool and hepatomegaly. In the study conducted by Lee et al, two sensitive clinical features have been introduced for the diagnosis of BA, i.e., tangible liver, which was ≥ 4 cm, and acholic stool; the sensitivity of these features were 94% and 77%, respectively [14]. However, in another study, this significant relationship has not been reported. As for ascites, it can be stated that 8 patients (21.6%) from the NH group had ascites, while none of the BA patients had ascites; this difference was statistically significant (P-value <0.017). It can be concluded that, in comparison with BA patients, the incidence rate of ascites was significantly higher in NH patients [15,16]. By investigating the disease diagnosis through ultrasonographic diagnosis before conducting the liver biopsy and comparing it with the biopsy results, it was concluded that the ultrasonographic diagnosis was consistent with the final diagnosis only in 9 patients (36%) out of the 25 patients of the BA group. Since ultrasonographic criteria were available for the diagnosis of the BA patients, ultrasonography was applied only for the diagnosis of BA [17]. However, in the meta-analysis conducted by Zhou et al, ultrasonography had high sensitivity (85%) and specificity (92%) for the diagnosis of BA [18]. This result seems weak and calls for conducting a comprehensive study to investigate the causes of the issue, including the radiologist’s experience, the quality and accuracy of the ultrasonography machines, etc. By investigating the results of laboratory tests (Tab. 4) and comparing NH and BA groups, it was observed that the groups were significantly different in terms of the results of certain laboratory tests. The mean enzyme value of AST was 434 ± 363 IU/ L in the NH group and 159 ± 117 IU/ L in the BA group; there was a significant difference between the groups (P-value <0.001). The mean enzyme value of ALT was 242 ± 190 IU/ L in the NH group and 81 ± 42 IU/ L in the BA group; there was a significant difference between the groups (P-value <0.001). The ALT/ ALP ratio (R factor) was 0.21 ± 0.18 in the NH group and 0.05 ± 0.02 in the BA group; there was a significant difference between the groups (P-value <0.001). Although the mean enzyme of ALP was 1313 ± 725 IU/ L in the NH group and 1,695 ± 1,045 IU/ L in the BA group (there was no significant statistical difference, P-value = 0.136), the ALT/ ALP ratio (R factor) was completely significant. The mean value of direct bilirubin was 7.6 ± 4.1 mg/ dL in the NH group and 5.6 ± 2.6 mg/ dL in the BA group; there was a significant difference between the groups (P-value <0.030) [19,20].
Conclusion
The results of the present study suggest R factor as a non-invasive diagnostic marker for distinguishing intrahepatic from extrahepatic causes of infant cholestasis. The R factor seems to have good diagnostic accuracy in comparison with liver biopsy, which is an invasive method and the gold standard of diagnosis. Further studies with larger a sample size are recommended.
Prof. Iraj Shahramian, MD
Pediatric Gastroenterology and Hepatology Research Center
Zabol University of Medical Sciences
Shahid Rajaei Street
9861615881 Zabol
Iran
Conflict of Interest: The authors declare that the article/ manuscript complies with ethical standards, patient anonymity has been respected, and they state that they have no financial, advisory or other commercial interests in relation to the subject matter.
Publication Ethics: This article/ manuscript has not been published or is currently being submitted for another review. The authors agree to publish their name and e-mail in the published article/ manuscript.
Dedication: The article/ manuscript is not supported by a grant nor has it been created with the support of any company.
The Editorial Board declares that the manuscript met the ICMJE “uniform requirements” for biomedical papers.
Sources
- Voutilainen S, Kivisaari R, Lohi J et al. A prospective comparison of noninvasive methods in the assessment of liver fibrosis and esophageal varices in pediatric chronic liver diseases. J Clin Gastroenterol 2016; 50(8): 658–563. doi: 10.1097/ MCG.0000000000000532.
- Wolowich WR. Mary Lee. Basic skills in interpreting laboratory data. 4th ed. Bethesda, MD: American Society of Health-System Pharmacists 2009.
- Zimmerman HJ, Ishak KG. General aspects of drug-induced liver disease. Gastroenterol Clin North Am 1995; 24(4): 739–757.
- Aithal GP, Watkins PB, Andrade RJ et al. Case definition and phenotype standardization in drug-induced liver injury. Clin Pharmacol Ther 2011; 89(6): 806–815. doi: 10.1038/ clpt.2011.58.
- Norris W, Paredes AH, Lewis JH. Drug-induced liver injury in 2007. Curr Opin Gastroenterol 2008; 24(3): 287–297. doi: 10.1097/ MOG.0b0 13e3282f9764b.
- Andrade RJ, Lucena MI, Kaplowitz N et al. Outcome of acute idiosyncratic drug-induced liver injury: long-term follow-up in a hepatotoxicity registry. Hepatology 2006; 44(6): 1581–1588. doi: 10.1002/ hep.21424.
- Yu Z, Fu SP, Zhan J et al. Investigation of application of ALT/ ALP ratio in the differential diagnosis of jaundice. J Biosci Med 2012; 2 : 1–4.
- Dehghani SM, Haghighat M, Imanieh MH et al. Comparison of different diagnostic methods in infants with cholestasis. World J Gastroenterol 2006; 12(36): 5893–5896. doi: 10.3748/ wjg.v12.i36.5893.
- Rafeey M, Saboktakin L, Hasani JS et al. Diagnostic value of anti-smooth muscle antibodies and liver enzymes in differentiation of extrahepatic biliary atresia and idiopathic neonatal hepatitis. Afr J Paediatr Surg 2016; 13(2): 63–68. doi: 10.4103/ 0189-6725.182558.
- Disk MC,Mowat AP. Hepatitis syndrome in infancy – an epidemiological survey with 10 year follow up. Arch Dis Child 1985; 60(6): 512–516. doi: 10.1136/ adc.60.6.512.
- Mowat AP, Psacharopoulos HT, Williams R. Extrahepatic biliary atresia versus neonatal hepatitis. Review of 137 prospectively investigated infants. Arch Dis Child 1976; 51(10): 763–770. doi: 10.1136/ adc.51.10.763.
- Abou-Taleb A, Abdelhameed W, Ahmed A et al. Non-invasive diagnostic methods for differentiation of biliary atresia from neonatal hepatitis in upper Egypt. Int J Pediatr 2019; 7(4): 9265–9275. doi: 10.22038/ ijp.2018.36960.3219.
- Balistreri WF. Neonatal cholestasis. J Pediatr 1985; 106(2): 171–184. doi: 10.1016/ s0022-3476 (85)80282-1.
- Lee WS, Chai PF. Clinical features differentiating biliary atresia from other causes of neonatal cholestasis. Ann Acad Med Singap 2010; 39(8): 648–654.
- Moyer V, Freese DK, Whitington PF et al.Guideline for the evaluation of cholestatic jaundice in infant: recommendations of theNorth American Society for Pediatric Gastroenterology, Hepatology and Nutrition. J Pediatr Gastroenterol Nutr 2004; 39(2): 115–128. doi: 10.1097/ 00005176-200408000-00001.
- Desmet VJ. Congenital diseases of intrahepatic bile ducts: variations on the theme “ductal plate maalformation”. Hepatology 1992; 16(4): 1069–1083. doi: 10.1002/ hep.1840160434.
- Visser BC, Suh I, Hirose S et al. The influence of portoenterostomy on transplantation for biliary atresia. Liver Transpl 2004; 10(10): 1279–1286. doi: 10.1002/ lt.20234.
- Zhou L, Shan Q, Tian W et al. Ultrasound for the diagnosis of biliary atresia: a meta-analysis. AJR Am J Roentgenol 2016; 206(5): W73–W82. doi: 10.2214/ AJR.15.15336.
- Barshes NR, Lee TC, Balkrishnan R et al. Orthotopic liver transplantation for biliary atresia: the U.S. experience. Liver Transpl 2005; 11(10): 1193–1200. doi: 10.1002/ lt.20509.
- Utterson EC, Shepherd RW, Sokol RJ et al. Biliary atresia: clinical profiles, risk factors, and outcomes of 755 patients listed for liver transplantation. J Pediatr 2005; 147(2): 180–185. doi: 10.1016/ j.jpeds.2005.04.073.
Labels
Paediatric gastroenterology Gastroenterology and hepatology SurgeryArticle was published in
Gastroenterology and Hepatology

2021 Issue 2
Most read in this issue
- Liver injury after the use of anabolic steroids to promote muscle growth – single-center experience
- Teduglutide, a glucagon-like peptide-2 analogue (REVESTIVE), in the treatment of short bowel syndrome with dependence on home parenteral nutrition
- Laparoskopická nebo klasická splenektomie?
- Posuzování funkce ledvin u pacientů s jaterním onemocněním