
Formulation development of anti-stress compressed lozenges using a fractional factorial Latin cube design and ANOVA approach
Authors:
Oleksii Yakovenko 1; Tetiana Kolisnyk 1; Lena Ruban 1; Natalia Fil 2
Authors‘ workplace:
Department of Industrial Technology of Drugs, National University of Pharmacy, Ukraine
1; Department of Automation and Computer-Integrated Technologies, Kharkiv National Automobile and Highway University, Ukraine
2
Published in:
Čes. slov. Farm., 2021; 70, 66-78
Category:
Original Article
doi:
https://doi.org/10.5817/CSF2021-2-66
Overview
The aim of this work was to develop anti-stress compressed lozenges containing 100 mg of glycine and 250 mg of magnesium citrate obtained by the direct compression method. To choose optimal excipient composition providing the sufficient pharmaco-technical properties of the tablet blend, mechanical strength of tablets and non-disintegrating, slow-dissolving behavior of compressed lozenges during sucking, 27 experimental formulations according to fractional factorial Latin cube design were prepared and tested. The excipients used in the study were: Mannogem® EZ, Cellactose® 80 and GalenIQ™ 721 (fillers); Plasdone™ S-630, Kollidon® 90 F and Avicel® PH-101 (dry binders); Metolose® 90SH-4000SR and guar gum (gel-forming binders); PRUV®, Neusilin® US2, and Compritol® 888 CG ATO (antifriction excipients). The following parameters were investigated as responses: bulk density, Carr’s index, friability, resistance to crushing, and in vitro disintegration time. ANOVA approach was applied for statistical processing, which allowed to reveal the individual effects of each excipient and several interaction effects observed for the excipient amounts used in this study. Isomalt (GalenIQ™ 721), copovidone (Plasdone™ S-630), and glyceryl behenate (Compritol® 888 CG ATO) were selected to be incorporated in the final formulation of compressed lozenges.
Keywords:
compressed lozenges – glycine, magnesium citrate – stress-protective activity – formulation development – design of experiment – Analysis of variance
Introduction
Oromucosal administration of drugs offers several advantages over the traditional oral route. One of the most important among them is the ability of a drug to be rapidly absorbed through the oral mucosa and directly enter the systemic circulation, avoiding in such a way (at least, partially) the first-pass metabolism in the gastrointestinal tract (GIT)1).
Compressed lozenges are one of three types of oromucosal tablets, distinguished by the European Pharmacopoeia (Ph. Eur.)2). Unlike the other two types, which are sublingual tablets and buccal tablets, compressed lozenges may be intended for systemic or local action (in the latter case, e.g., for the treatment of cold-related throat conditions). The principal difference of compressed lozenges from the oromucosal tablets mentioned above involves the oral cavity site, where the drug delivery should occur. In a few words, sublingual tablets are applied precisely under the tongue and buccal tablets to the cheeks’ inner lining, whereas compressed lozenges are aimed to be sucked. Hence, they deliver a drug to various regions of the oral cavity. These administration features are reasoned by the oral epithelium properties, and they determine certain specific requirements for each type of tablets. For instance, both sublingual and buccal epithelia are non-keratinized. However, the first one is regarded as the most efficient place in the oral cavity for drug absorption since it is 2.5–6 times thinner than the buccal one. At the same time, the sublingual area is relatively small and constantly undergoes washing by the saliva and movements of the tongue3–5). Therefore, sublingual tablets are only suitable for low-dose drugs (usually, not more than 10 mg per dosage unit), which can rapidly dissolve in the saliva and then be immediately absorbed. Accordingly, these tablets must quickly disintegrate on contact with small amounts of liquid (i.e., saliva) to facilitate drug dissolution. Otherwise, most of the drug is flowed down with the saliva and ingested in the GIT. In turn, the buccal mucosa is much less affected by the saliva flow or by the tongue, allowing buccal preparations to retain in contact with mucosal lining for a longer period. To extend the retention time, mucoadhesive properties are preferred for the buccal preparations, including buccal tablets6, 7).
As to compressed lozenges, the necessity of sucking them requires this type of tablets to be non-disintegrating and slow-dissolving, which is usually achieved through high hardness and/or the addition of certain binders such as tragacanth, methylcellulose, etc.8, 9). In the case of systemic preparations, sucking may help to distribute the dose of the drug throughout the mouth, providing absorption of it by different oral regions; for this purpose, the drug’s release rate should be slow enough to avoid as much as possible its swallowing. If such a task is solved, then drugs with a higher dose (as compared to sublingual tablets) may also be used in oromucosal delivery systems. It should also be noted that there is an additional effect of sucking as a way of taking drugs, such as physiological soothing. As it was reported, suckling is linked with oxytocin release in infants through activation of touch receptors in the oral cavity10, 11). This hormone, mostly recognized as involved in labor and breastfeeding, has been reported to reduce fear and anxiety and produce antidepressant-like effect12, 13). In light of this, it is supposed that smoking addiction in adults is provoked not only by nicotine but also oxytocin release effects when sucking on cigarettes11). This explains the usefulness of candy lozenges in smoking cessation, as well as the rationale for incorporation of nicotine replacement products in the form of compressed lozenges or chewing gums (e.g., Nicorette® and Nicotinell®). From this point of view, in such preparations, the pharmacological effect of nicotine is augmented by the physiological calming action of sucking or mastication.
Therefore, we consider compressed lozenges as an appropriate dosage form to develop the anti-stress formulation containing glycine and magnesium citrate as active pharmaceutical ingredients (APIs). Glycine is the simplest amino acid representing the major inhibitory neurotransmitter in the adult central neural system (CNS)14, 15). There are scientific reports on the efficacy of glycine in improving sleep quality, its neuroprotective effects for the therapy of acute ischemic stroke, as well as positive action in the animal models of hypertension and cognitive function assessment, etc.16–21). Glycine in the form of sublingual tablets (100 mg per tablet) is an approved medicinal product in Russia, Ukraine, Belarus, and some other countries. A recent study in rodents has confirmed glycine anti-anxiety effect; however, it was also shown that the stress-protective action of glycine can be enhanced by combining it with magnesium citrate22). The latter is a soluble organic salt of magnesium, a deficiency of which is known to be related to stress reactions23, 24). It is worth noting that, unlike most drug substances, both glycine and magnesium citrate do not have a bitter, unpleasant taste (glycine is sweetish, and magnesium citrate is slightly acidic), which makes them favorable candidates for oromucosal preparations.
Thus, the present study was devoted to the formulation development of compressed lozenges containing glycine and magnesium citrate. Design of experiment (DoE) methodology and analysis of variance (ANOVA) approach were applied to select optimal excipients that allow achieving best manufacturability of the finished product (in terms of flowability and compressibility of tablet blend), as well as its pharmaco-technical characteristics – standard for all tablets (absence of appearance defects, required mechanical resistance) and specific for this type of tablets (non-disintegrating, slow-dissolving behavior).
Experimental part
Materials
The following substances were used to obtain experimental formulations of compressed lozenges: glycine and magnesium citrate (PureBulk Inc, USA), spray-dried mannitol (Mannogem® EZ, SPI Pharma, USA), a co-spray dried mixture of the alpha-lactose monohydrate and microcrystalline cellulose (Cellactose® 80, Meggle G.m.b.H., Germany), spherical isomalt for direct compression (GalenIQ™ 721, BENEO–Palatinit GmbH, Germany), N-vinyl-2-pyrrolidone and vinyl acetate (Plasdone™ S-630 copovidone, Ashland Inc.), high-molecular weight povidone (Kollidon® 90 F, BASF SE, Germany), microcrystalline cellulose (Avicel® PH-101, FMC Corporation, USA), hypromellose (Metolose 90SH-4000SR, Shin-Etsu Chemical Co. Ltd, Japan), guar gum (Sigma Aldrich, USA), sodium stearyl fumarate (PRUV®, JRS Pharma GmbH & Co. KG, Germany), magnesium aluminometasilicate (Neusilin® US2, Fuji Chemical Industry Co. Ltd., Japan), glyceryl behenate (Compritol® 888 CG ATO, Gattefossé, France).
Experimental design
Latin cube fractional factorial design, which involves the investigation of four factors, each varying at three levels with 2 complete replications, was utilized in this study. Factors, levels, and responses according to experimental design are listed in Table 1.

Preparation of compressed lozenges
Experimental formulations of compressed lozenges were prepared by the direct compression method. For this purpose, glycine and magnesium citrate (100 and 250 mg per tablet, respectively) were sieved through a sieve with a pore diameter of 0.2 mm and then thoroughly mixed with excipients corresponding to each formulation using a mortar and a pestle. After evaluating the bulk properties, all powder blends were directly compressed into flat-faced cylindrical tablets with a diameter of 11 mm and a nominal weight of 500 mg using a laboratory single-punch tablet machine. All formulations were obtained in two replicates.
Evaluation of the bulk properties of the powder blends
Bulk properties of each formulation were assessed by the bulk density and Carr’s index according to Ph. Eur. 10.0 chapters 2.9.34 “Bulk density and tapped density of powders” and 2.9.36 “Powder flow” 2). Pharma Test tap density tester (model PT-TD1, Germany) was used to determine the bulk and tapped density values, and based on these data, Carr’s index was calculated. All measurements were repeated 3 times.
Evaluation of the prepared compressed lozenges
The prepared compressed lozenges were evaluated by their friability, resistance to crushing, and time of disintegration (dissolution).
Friability and resistance to crushing determinations were carried out by pharmacopoeial tests described in chapters 2.9.7 “Friability of uncoated tablets” and 2.9.8 “Resistance to crushing of tablets” using a PTF 20E friability apparatus (Pharma Test, Germany) and a Monsanto hardness tester (Campbell Elec., India), respectively2).
To assess the behavior of the compressed lozenges in a liquid medium (whether it is disintegrating or not and how much time it takes), the disintegration test was performed in accordance with Ph.Eur. chapter 2.9.1 “Disintegration of tablets and capsules” using BJ-2 disintegration apparatus (MINHUA Pharmaceutical Machinery Co., Ltd., China) and purified water as a disintegration medium2).
All tablet evaluation measurements were repeated 6 times.
In vivo sucking time of compressed lozenges
For estimation of in vivo sucking time of the formulations selected by statistical analysis, six healthy volunteers were asked just to suck each sample of compressed lozenges until it completely dissolves without treating it by the tongue and the time of sucking was registered. Volunteers also were asked about their subjective perceptions while sucking (concerning taste and aftertaste assessment).
Statistical processing and interpretation of the experimental data
The experimentally determined responses from 27 formulations were processed by the ANOVA approach. All calculations were conducted using Microsoft Excel 2010 software. Every set of the studied responses was processed by the same algorithm as described below25).
At the first step the variances (s2) were estimated for each replicate pair of 27 experiments and the variance homogeneity assumption was checked by Cochran variance outlier test. To do this, the experimental Cochran’s C value (Cexp) was determined as and then compared with its tabulated critical value at α = 0.05 (total number of experimental formulations (N) is 27, and degrees of freedom (f) is equal to the number of replications (r) minus 1) (C0.05). In case Cochran’s C value is lower than the critical value, the assumption of variance homogeneity is met, and ANOVA may be performed.
Briefly, the ANOVA approach involved calculating the sums of squares (SS), the mean squares (MS), and the variance ratios. The last ones are commonly called the F statistic values and estimated as the ratios of variance due to the effect of factor and variance due to the error term. F value is used to evaluate the significance of the factor (or interaction of several factors) with respect to the variance of all of the factors included in the error term. A calculated F value (Fexp) is compared with a tabulated F-value at a given statistical level of significance and degrees of freedom (F0.05). The factor (or interaction of the factors) is considered to contribute to the sum of squares (within the confidence level) if Fexp is greater than the value from standard F-tables.
ANOVA calculations are carried out in the following sequence. The results by each level of the factors A, B, C, and D (Ai, Bj, Ck, and Dl, respectively) are summed up. Then SS are calculated by the formulas [1–5]:

where SST – the total squared deviation from the mean value of the data; SSA, SSB, SSC, and SSD are the sums of squared deviations by the levels from the mean for factors A, B, C, and D, respectively; yijkl – result, obtained in testing the formulation which is the combination of ith, jth, kth, and lth levels of factors A, B, C, and D, respectively; n – number of levels; r – number of replications.
Latin cube design with replicate experiments gives the possibility to evaluate the effect of paired factor interactions on the responses. To do this, the effects of at least one of four factors on the rest should be slighted. In this work factor C (gel-forming binder) was considered as a blocking or nuisance factor (i.e., a factor that has some effect on the responses but is of no interest to the experimenter). This consideration is argued by the fact that the only purpose of these excipients to be included in the formulation was assumed to slow down the disintegration of compressed lozenges in the liquid medium; however, the best results were obtained in the absence of a gel-forming binder (see Results and Discussion sections). Therefore for all responses including disintegration time factor C was assumed to be negligible. SS for the paired interactions AB, AD, BD, and triple interaction ABD are determined using the formulas [6–9]:

where AiBj , AiDl , BjDl are the sums of the response results from the certain combination of levels of corresponding factors (each sum consists of 6 components).
Then the formula [10] is used to find the sum of squares error (SSE):

where ABCD – the sum of the replicate experiments for the DoE formulation, defined by a combination of levels of the factors A, B, C, and D.
The MS for each SS are estimated as the ratio of SS to corresponding f, where fA = fB = fC = fD = n – 1; fAB = fAD = fBD = (n – 1)2; and fABD = (n – 1)3 – (n – 1). Fexp values are determined by the general formula [11]:

where MSE – the mean squared error (at fE = n3(r – 1)).
To interpret the experimental results and select the optimal formulation(s) for further investigation, the main effects of all individual factors and interaction effects of factor pairs on each response were graphically analyzed. The main effects were plotted as mean values from Ai, Bj, Ck, and Dl against each corresponding level for every response. The conclusion about the significance of the differences between the levels was made taking into account the confidence interval, calculated as , where t0.05 – Student’s t-test at a 0.05 significance level. Graphical analysis of the paired interaction effects was carried out by plotting the change in response mean values of a certain level of one factor depending on the level of another factor.
Results
The experimental design matrix and results for all responses are given in Table 2.

The data of Cochran variance outlier test and ANOVA processing for each response studied are shown in Table 3.
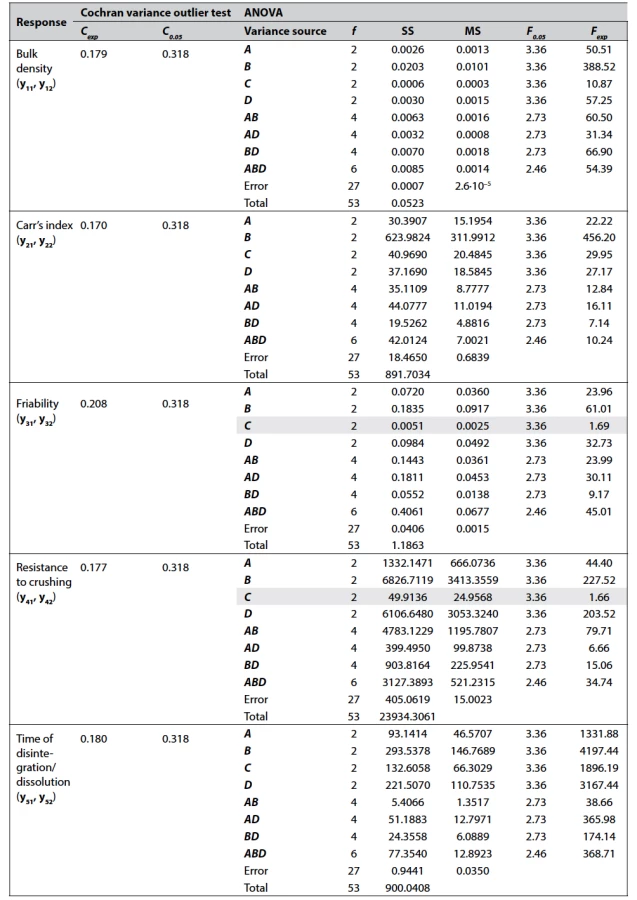
As it can be seen from Table 3, the factors A, B, and D have a significant effect on all responses which were studied, while the factor C (gel-forming binder) is significant only for bulk density, Carr’s index, and time of disintegration of the formulations. It was also found that pairwise interactions AB, AD, and BD are significant for all responses, which means that the effect of each factor depends on the other one of the pair. The significance of the triple interaction ABD indicates that the effect of any pair of levels depends on the level of the third factor.
Based on statistical processing and further data interpretation, the following formulations were selected for final testing, including in vivo sucking time determination: a2b1c1d3, a3b1c1d3, a1b1c1d3, a2b1c1d1, a1b1c1d1, a3b1c1d1. The results are given in Table 4.

Discussion
The approach of the DoE and statistics based approaches for decision making has gained a widespread occurrence in the pharmaceutical science and drug development field; nevertheless, most reports relating to this issue describe the DoE application in the frame of optimization26–31). It means that the DoE method is used to choose optimal levels of quantitative parameters (independent variables) allowing to obtain best-fit responses (dependent variables). In the case of formulation development study, independent variables may be different concentrations of selected excipients, whereas dependent ones – drug quality attributes. On the other hand, for the majority of pharmaceutical excipients, there are data, available in the literature or provided by manufacturers, on recommended excipient dosing for various functional performances. So, very often it is the choice of excipient types that becomes a real challenge. In this regard, it is worthy to note that DoE and data statistic processing methods are applicable not only for quantitative decisions (i.e., as optimization tool) but also for choosing qualitative factors, including the types of excipients. For this purpose, the ANOVA method is best fitted as statistically valid decision-making on the choice of qualitative factors.
Traditionally two-dimensional Latin square designs are the most popular for ANOVA-based choice of qualitative variables, which is related to the simplicity of such model statistics processing and a small number of experimental runs. Nevertheless, with Latin square it is not possible to estimate any interaction terms, which may be of great interest considering pharmaceutical preparation as a complex interacting system. To overcome this drawback Latin square can be extended to three or more dimensions to obtain Latin cube or Latin hypercube designs and in this case, two-factor interactions are statistically interpreted. In this work, we chose a fractional factorial Latin cube design with two replications in order to assess the effect of four factors varying at three levels, including the main effects of each factor (individually) and interaction effects of their paired combinations.
A pre-step of every formulation development study is the selection of the factors which effect to be studied. When solving this issue, first of all, we considered the principal technological feature of compressed lozenges – non-disintegrating and slow-dissolving behavior in liquid media. Obviously, this can be achieved by strong binding powder particles with each other, which prevents the rapid penetration and spread of liquid in the tablets. As a rule, the most effective binding results from the wet granulation tableting method; however, in comparison with direct compression, it involves more stages and additional equipment units and, consequently, consumes more time and costs. Therefore, the excipients for direct compression with a declared good compression profile were selected for the study. For instance, spray-dried mannitol (Mannogem® EZ), lactose co-processed with microcrystalline cellulose (Cellactose® 80), and isomalt (GalenIQ™ 721) were selected as directly compressible fillers with a pleasant taste. In order to attain good coupling of powder particles, the dry binders, such as Plasdone™ S-630, Kollidon® 90 F, and Avicel® PH-101, were included in the DoE plan. The necessity for the addition of another binder type – gel-forming was also investigated. Such excipients were assumed to prolong dissolution by forming a viscous layer around the tablet and slowing down its disintegration. This assumption is supported by the fact that some commercially available compressed lozenges contain gel-forming excipients such as natural gums and cellulose derivatives. In view of this, we compared the effect of Metolose 90SH-4000SR, guar gum, and the absence of a gel-forming binder. And the last group of excipients that were chosen for the study is the substances improving powder flow (and they also affect tablet disintegration/dissolution primarily due to their hydrophobic nature) – PRUV®, Neusilin® US2, and Compritol® 888 CG ATO.
The inclusion of replications in the DoE makes it necessary to evaluate the reproducibility of the results obtained in different replicas before processing the experimental data. In this paper, reproducibility means within-laboratory consistency, and since all experiments in both replicas were performed on the same equipment and by the same operators, the source of possible inconsistency is only random errors. For examining the within-laboratory consistency, Cochran’s test is recommended by ISO 5725-2. Comparison of the experimental Cochran’s C value (Cexp) with the tabulated critical value (C0.05) for each response (see Table 3 in the Results section) indicates the consistency of the results obtained.
Taking into account the primary technological goal in the formulation development of compressed lozenges (i.e., slow-dissolving behavior), the experimental data of the disintegration test were chosen as a starting point for the interpretation. Figure 1 shows the histogram of factor main effects on the mean values of disintegration time (calculated from Ai, Bj, Ck, and Dl) (I) and plots of paired interaction effects (II).
From Figure 1-I it can be seen that among all factors studied, the most prominent difference between the levels occurs for the dry binder types. In the case of compressed lozenges, in vitro disintegration time of about 10–20 min is considered as appropriate, which is supposed to correspond to around 5–10 min in vivo sucking time32). Hence, Plasdone™ S-630 (b1) is the most effective dry binder, irrespectively of the other factor levels. The latter becomes clear from b1-level plots, which for all a and d levels give higher response mean values (Fig. 1-II). The preference rank order for the dry binders can be expressed as Plasdone™ S-630
(b1) > Kollidon® 90 F (b2) > Avicel® PH-101 (b3). Therefore Plasdone™ S-630 is chosen as an undoubted favorite for the formulation being developed, while when choosing the levels of factors A and D, the contribution of their main and interaction effects to all responses was taken into account. For instance, preference rank orders for these factors by the disintegration test are GalenIQ™ 721 (a3) > Mannogem® EZ (a1) > Cellactose® 80 (a2) and Compritol® 888 CG ATO (d3) > PRUV® (d1) > Neusilin® US2 (d2) (Fig. 1-I). Assessment of AD level interaction revealed that the best three filler–antifriction excipient combinations are ranked as a3d3 > a1d1 = a2d3 (Fig. 1-II). As for factor C, the results that we obtained are opposite to those expected: the longer disintegration time mean values are found in the absence of a gel-forming binder (c1). Since the function of the factor C excipients is supposed to be the prolongation of tablet disintegration time, these results indicate that the addition of both hypromellose (c2) and guar gum (c3) is useless. Besides, according to modern tendencies in the pharmaceutical industry, every excipient in drug formulation is associated with certain risks; therefore, elimination of excipients that have not proved their functionality also reduces the overall risk for the developed drug33). Probably, the inefficiency of gel-forming binders may be explained that when these excipients are used in amounts of 3% their swelling rather promotes tablet expansion and water penetration into it than contribute to forming of gel viscous enough to inhibit the disintegration process. Accordingly, the conclusion about the uselessness of the gel-forming binders is only valid for 3% amounts, which, in fact, represents the limitation of the DoE applied in choosing qualitative factors without varying their quantities. Nevertheless, it is decided that there is no need for the additional investigation of other amounts or types of such excipients because the set goal is achievable without them.

The final formulation of compressed lozenges must meet not only certain biopharmaceutical requirements on its release behavior but also be manufacturable. Therefore the bulk density and Carr’s index, reflecting technological properties of the tablet blend, as well as mechanical strength characteristics of compressed tablets, were included in the DoE. So, hereinbelow the data obtained from the analysis of these responses are discussed.
The bulk density of a tablet blend determines the required volume of the tablet machine die cavity since die filling during compression is a volumetric process. Most pharmaceutical powders have bulk densities in the range of 0.1–0.7 g/cm3, and values closer to the upper edge of this range are preferable as they facilitate dosing the active ingredient in patient acceptably sized dosage forms34). According to the bulk density mean values Plasdone™ S-630 (b1), previously chosen in the disintegration test as a favorite among dry binders, ranks last significantly losing to Kollidon® 90 F (b2) and to a lesser extent – Avicel® PH-101 (b3) (Fig. 2-I). However, if consider level interactions, a1b1 gives higher mean values than all aib3 combinations (Fig. 2-II). As for factor D levels, PRUV® (d1) appears to be the best both by main factor effects (Fig. 2-I) and among b1dl combinations (Fig. 2-II), while Compritol® 888 CG ATO (d3) is the best antifriction excipient for GalenIQ™ 721 (a3) (i.e., a3d3 combination). For factor C the absence of a gel-forming binder (c1) and the use of guar gum (c2) are equally the best levels.

Carr’s index calculated from the bulk and tapped density are a pharmacopoeial parameter used to characterize powder flowability. Lower Carr’s indices evidence on the better flowability of the tablet blend samples2). From this point of view, Plasdone™ S-630 (b1) ranks second after Kollidon® 90 F (b2), which is the leader among dry binders (Fig. 3-I) and no matter what ai or dl level it is combined with (Fig. 3-II). Combinations of Plasdone™ S-630 (b1) also do not differ dramatically. However, a2b1 and b1d3 may be regarded as those with the lowest response mean values. Preference rank orders by Carr’s index for factors A and D are expressed as GalenIQ™ 721 (а3) > Cellactose® 80 (a2) = Mannogem® EZ (a1) and Compritol® 888 CG ATO (d3) > Neusilin® US2 (d2) = PRUV® (d1), respectively (Fig. 3-I). AD combinations with the lowest mean values of Carr’s index are a3d3, a3d2, and a2d2 (Fig. 3-II).

Friability is the measure of the tablet’s resistance to the subsequent process condition and transportation; lower friability values indicate better mechanical properties of the tablets35). According to pharmacopoeial requirements friability of tablets should not exceed 1%2). As it comes from Figure 4-I preference rank orders for levels of the factors A, B, and D can be described as Cellactose® 80 (a2) > GalenIQ™ 721 (а3) > Mannogem® EZ (a1), Avicel® PH-101 (b3) > Plasdone™ S-630 (b1) > Kollidon® 90 F (b2), and Compritol® 888 CG ATO (d3) = PRUV® (d1) > Neusilin® US2 (d2), respectively, while factor C is insignificant. Interestingly, when comparing the preference rank order of factor B levels with that one obtained for Carr’s index, it can be easily found that they are exactly opposite. This means that the dry binder Kollidon® 90 F (b2) giving the best Carr’s index results in the highest friability, and inversely, the loser at Carr’s index test Avicel® PH-101 (b3) provide the lowest tablet friability. This can be understood as follows: flowability, and hence Carr’s index, is better when interparticle adhesion is less; in turn, greater particle adhesive capacity leads to less friability, i.e. the ability of powder particles to detach from the tablet surface under mechanical stress. In general, the more compressible is the material the less flowable it will be; therefore, one of the main challenges in tablet formulation development is to achieve good flowability of a tablet blend with good mechanical properties of tablets36). It should also be focused on higher friability values obtained in testing formulations with Neusilin® US2 (d2). Obviously, this is related to visible surface defects such as chipping and partial capping, detected for most d2-formulations but not for d1 or d3 levels. Based on this, we can conclude that despite Neusilin® US2 is effective enough as a glidant (which is confirmed by Carr’s index testing), it has insufficient anti-adherence activity, i.e., in the amount of 2%, it is not able to prevent the adhesion of the tablet blend to tablet machine punches. On the other hand, an increase in the content of Neusilin® US2 in the tablets may negatively affect the taste of the formulation being developed. As for the interaction of factors, the best combinations of Plasdone™ S-630 (b1) in terms of friability turned out to be a2b1 and b1d3, while among AD combinations, the lowest mean values are obtained from a2d1, a2d3, and a3d1 (Fig. 4-II).

Resistance to crushing is another pharmacopoeial technical parameter used to evaluate tablet mechanical properties. Along with friability, it indicates the ability of tablets to be processed (in the case of coating), packed, and transported without fracturing. However, from the point of view that this parameter shows binding efficacy of powder particles, it is also linked to the behavior of compressed dosage units in liquid media, i.e., disintegration rate. Consequently, for compressed lozenges, values of resistance to crushing greater than those for traditional tablets should be achieved. As it comes from Figure 5-I, the most contribution in tablet resistance to crushing is made by Plasdone™ S-630 (b1) and Compritol® 888 CG ATO (d3). Avicel® PH-101 (b3), a leader among dry binders in friability test, ranks second. Differences in dry binder rank orders may be linked to different predominating binding mechanisms of these excipients. Probably, the binding ability of Plasdone™ S-630 (b1), a water-soluble copolymer, to a great extent is facilitated by moisture that releases from powders during the compression process and enforces the formation of hydrogen bond bridges between particles. Taking into account the relatively low moisture content of pharmaceutical powders, moisture-mediated binding appears to be more effective inside the tablets than on their surface, so it contributes more to crushing resistance than friability. At the same time, Avicel® PH-101 (b3), a water-insoluble excipient, is known for its excellent plastic deformability under pressure, which increases the area of both surface and internal particle-particle contact and cohesion37). Among level combinations, the most positive effects on tablet crushing resistance are observed for b1d3, a2b1, a2d3, and a1d3 (Fig. 5-II).

Based on described above experimental data analysis, four formulations are selected for additional investigation: a2b1c1d3, a3b1c1d3, a1b1c1d3, and a2b1c1d1. It should be noted that we considered only formulations with levels b1 and c1 for factors B and C, respectively, and excluded formulations with level d2 for factor D. From the results given in Table 4 (see “Results” section), formulation a3b1c1d3 is chosen as that one providing sufficient pharmaco-technical properties of tablet blend, mechanical characteristics of compressed tablets, their non-disintegrating, slow-dissolving behavior, as well as pleasant taste and mouthfeel during sucking. The composition of the chosen formulation of compressed lozenges is presented in Table 5.

Conclusions
This study has demonstrated the opportunity for DoE application in the formulation development as a tool to select types of excipients providing best-fit characteristics of the developed preparation. In order to develop anti-stress compressed lozenges containing glycine and magnesium citrate as active ingredients, 27 experimental formulations according to fractional factorial Latin cube design were tested on such parameters as bulk density, Carr’s index, friability, resistance to crushing, and tablet in vitro disintegration time. The latter was considered as the main attribute responsible for providing the preparation of its specific release properties – slow dissolution during sucking in the oral cavity. Using the ANOVA approach for statistical processing, the following excipients were selected to be incorporated in the final formulation: isomalt GalenIQ™ 721 (tablet filler), Plasdone™ S-630 copovidone (dry binder), and glyceryl behenate Compritol® 888 CG ATO (antifriction excipient). Data processing by ANOVA also allowed revealing excipient interaction effects on the parameters studied, which may be useful in similar formulation development studies.
Conflict of interest: none.
O. Yakovenko, Tetiana Kolisnyk, О. Ruban
Department of Industrial Technology of Drugs
National University of Pharmacy
Valentynіvska str. 4, 61168 Kharkiv, Ukraine
e-mail: kolisnyktatyana@gmail.com
N. Fil
Department of Automation and Computer-Integrated Technologies
Kharkiv National Automobile and Highway University, Kharkiv, Ukraine
Sources
- Zhang H., Zhang J., Streisand J. B. Oral mucosal drug delivery: clinical pharmacokinetics and therapeutic applications. Clin Pharmacokinet. 2002; 41(9), 661–680.
- Council of Europe. European Pharmacopoeia, 10th edition, Strasbourg: Council of Europe, 2019.
- Ashraf M., Sayeed V. A. Considerations in developing sublingual tablets – an overview. Pharm. Technol. 2014; 38(11), 38–47.
- Dawson D. V., Drake D. R., Hill J. R., Brogden K. A., Fischer C. L., Wertz P. W. Organization, barrier function and antimicrobial lipids of the oral mucosa. Int. J. Cosmet. Sci. 2013; 35(3), 220–223.
- Squier C. A. The permeability of oral mucosa. Crit. Rev. Oral. Biol. Med. 1991; 2(1), 13–32.
- Shinkar D. M, Dhake A. S, Setty C. M. Drug delivery from the oral cavity: a focus on mucoadhesive buccal drug delivery systems. PDA J. Pharm. Sci. Technol. 2012; 66(5), 466–500.
- Fonseca-Santos B., Chorilli M. An overview of polymeric dosage forms in buccal drug delivery: State of art, design of formulations and their in vivo performance evaluation. Mater Sci. Eng. C Mater Biol. Appl. 2018; 86, 129–143.
- Maheshwari R., Jain V., Ansari R., Mahajan S. C., Joshi G. A review on lozenges. Br. Biomed. Bull. 2013; 1, 35–43.
- Majekodunmi S. O. A review on lozenges. American Journal of Medicine and Medical Sciences 2015; 5(2), 99–104.
- Uvnäs-Moberg K., Prime D. K. Oxytocin effects in mothers and infants during breastfeeding. Infant. 2013; 9(6), 201–206.
- Uvnäs-Moberg K., Handlin L., Petersson M. Self-soothing behaviors with particular reference to oxytocin release induced by non-noxious sensory stimulation. Front. Psychol. 2015; 5, 1529.
- Guzmán Y. F., Tronson N. C., Jovasevic V., Sato K., Guedea A. L., Mizukami H., Nishimori K., Radulovic J. Fear-enhancing effects of septal oxytocin receptors. Nat. Neurosci. 2013; 16(9), 1185–1187.
- Kirsch P., Esslinger C., Chen Q., Mier D., Lis S., Siddhanti S., Gruppe H., Mattay V. S., Gallhofer B., Meyer-Lindenberg A. Oxytocin modulates neural circuitry for social cognition and fear in humans. J. Neurosci. 2005; 25(49), 11489–11493.
- Gundersen R. Y., Vaagenes P., Breivik T., Fonnum F., Opstad P. K. Glycine – an important neurotransmitter and cytoprotective agent. Acta Anaesthesiol. Scand. 2005; 49, 1108–1116.
- Petrat F., Boengler K., Schulz R., de Groot H. Glycine, a simple physiological compound protecting by yet puzzling mechanism(s) against ischaemia-reperfusion injury: current knowledge. Br. J. Pharmacol. 2012; 165(7), 2059–2072.
- Kawai N., Sakai N., Okuro M., Karakawa S., Tsuneyoshi Y., Kawasaki N., Takeda T., Bannai M., Nishino S. The sleep-promoting and hypothermic effects of glycine are mediated by NMDA receptors in the suprachiasmatic nucleus. Neuropsychopharmacology 2015; 40(6), 1405–1416.
- Bannai M., Kawai N. New therapeutic strategy for amino acid medicine: glycine improves the quality of sleep. J. Pharmacol. Sci. 2012; 118(2), 145–148.
- Gusev E. I., Skvortsova V. I., Dambinova S. A., Raevskiy K. S., Alekseev A. A., Bashkatova V. G., Kovalenko A. V., Kudrin V. S., Yakovleva E. V. Neuroprotective effects of glycine for therapy of acute ischaemic stroke. Cerebrovasc. Dis. 2000; 10(1), 49–60.
- El Hafidi M., Pérez I., Baños G. Is glycine effective against elevated blood pressure? Curr. Opin. Clin. Nutr. Metab. Care 2006; 9(1), 26–31.
- Imtiaz S., Ikram H., Ayaz M., Qadir M. I., Muhammad S. A. Effect of glycine: Studying memory and behavioral changes in mice. Pak. J. Pharm. Sci. 2018; 31(5), 1943–1949.
- Razak M. A., Begum P. S., Viswanath B., Rajagopal S. Multifarious Beneficial Effect of Nonessential Amino Acid, Glycine: A Review. Oxid Med. Cell Longev. 2017; 2017, 1716701.
- Yakovenko O., Ruban O., Devyatkina N., Devyatkina T. Study of the stress-protective effect of the combination of glycine with magnesium citrate. Norwegian Journal of development of the International Science 2020; 48, 52–58.
- Sartori S. B., Whittle N., Hetzenauer A., Singewald N. Magnesium deficiency induces anxiety and HPA axis dysregulation: modulation by therapeutic drug treatment. Neuropharmacology 2012; 62(1), 304–312.
- Tarasov E. A., Blinov D. V., Zimovina U. V., Sandakova E. A. Magnesium deficiency and stress: Issues of their relationship, diagnostic tests, and approaches to therapy. Ter. Arkh. 2015; 87(9), 114–122. Russian.
- Hroshovyi T. A., Martsenyuk V. P., Kucherenko L. I., Vronska L. V., Huryeyeva S. M. Mathematical planning of experiment in pharmacy. Ternopil, Ukraine: Ternopil State Medical University 2008. Ukrainian.
- Singh B., Kumar R., Ahuja N. Optimizing drug delivery systems using systematic “design of experiments.” Part I: fundamental aspects. Crit. Rev. Ther. Drug Carrier Syst. 2005; 22(1), 27–105.
- Dennison T. J., Smith J., Hofmann M. P., Bland C. E., Badhan R. K., Al-Khattawi A., Mohammed A. R. Design of Experiments to Study the Impact of Process Parameters on Droplet Size and Development of Non-Invasive Imaging Techniques in Tablet Coating. PLoS One 2016; 11(8), e0157267.
- Politis S. N., Colombo P., Colombo G., Rekkas D. M. Design of experiments (DoE) in pharmaceutical development. Drug Dev. Ind. Pharm. 2017; 43(6), 889–901.
- Fukuda I. M., Pinto C. F. F., Moreira C. S., Saviano A. M., Lourenço F. R. Design of Experiments (DoE) applied to Pharmaceutical and Analytical Quality by Design (QbD). Braz. J. Pharm. Sci. 2018; 54(Special), e01006.
- Saydam M., Takka S. Development and in vitro evaluation of pH-independent release matrix tablet of weakly acidic drug valsartan using quality by design tools. Drug Dev. Ind. Pharm. 2018; 44(12), 1905–1917.
- Wang Q., Wong C. H., Chan H. Y. E., Lee W. Y., Zuo Z. Statistical Design of Experiment (DoE) based development and optimization of DB213 in situ thermosensitive gel for intranasal delivery. Int. J. Pharm. 2018; 539(1–2), 50–57.
- Tietz K., Gutknecht S. I., Klein S. Bioequivalence of locally acting lozenges: Evaluation of critical in vivo parameters and first steps towards a bio-predictive in vitro test method. Eur. J. Pharm. Biopharm. 2018; 123, 71–83.
- Ruban O., Pidpruzhnykov Y., Kolisnyk T. Excipient risk assessment: possible approaches to assessing the risk associated with excipient function. J. Pharm. Investig. 2018; 48, 421–429.
- Hancock B. C., Colvin J. T., Mullarney M. P., Zinchuk A. V. The relative densities of pharmaceutical powders, blends, dry granulations, and immediate-release tablets. Pharm Technol. 2003; 27(4), 64–80.
- Pandeya A., Puri V. M. Relationships between tablet physical quality parameters and granulated powder properties: feasibility study. Particul. Sci. Technol. 2012; 30(5), 482–496.
- Sarraguça M. C., Cruz A. V., Soares S. O., Amaral H. R., Costa P. C., Lopes J. A. Determination of flow properties of pharmaceutical powders by near infrared spectroscopy. J. Pharm. Biomed. Anal. 2010; 52, 484–492.
- Paul S., Sun C. C. Dependence of Friability on Tablet Mechanical Properties and a Predictive Approach for Binary Mixtures. Pharm. Res. 2017; 34, 2901–2909.
Labels
Pharmacy Clinical pharmacologyArticle was published in
Czech and Slovak Pharmacy

2021 Issue 2
Most read in this issue
- Causes and interventions of medication errors in healthcare facilities
- Formulation development of anti-stress compressed lozenges using a fractional factorial Latin cube design and ANOVA approach
- Synthesis and HPLC enantioseparation of novel derivatives of 3-alkoxy-4-hydroxyphenylalkanones of a potential α/β-blocker type
- Investigation of the anabolic activity of dry extracts of Iris hungarica leaves and rhizomes on the model of hydrocortisone-induced protein catabolism