
Epidemiological Trends for Childhood and Adolescent Cancers in the Period 1994–2016 in the Czech Republic
Authors:
D. Krejci 1,2; M. Zapletalová 2; I. Svobodová 1,2; L. Pehalova 2; J. Muzik 1,2; D. Klimes 2; L. Snajdrova 1; V. Bajciova 3; P. Múdrý 3; D. Kodýtková 3; V. Smelhaus 4; I. Janotova 4; A. Vrzalová 4; A. Luks 4; J. Sterba 3; J. Starý 4; L. Dusek 1,2
Authors‘ workplace:
Institute of Biostatistics and Analyses, Faculty of Medicine, Masaryk University, Brno
1; Institute of Health Information and Statistics of the Czech Republic, Prague
2; Department of Paediatric Oncology, Faculty of Medicine, Masaryk University and University Hospital Brno
3; Department of Paediatric Haematology and Oncology, 2nd Faculty of Medicine, Charles University and University Hospital in Motol, Prague
4
Published in:
Klin Onkol 2019; 32(6): 426-435
Category:
Original Articles
doi:
https://doi.org/10.14735/amko2019426
Overview
Background: Our study aimed to evaluate incidence and mortality trends for childhood and adolescent cancers in the period 1994–2016 in the Czech Republic.
Material and methods: Data on childhood cancers, which are recorded in the Czech National Cancer Registry, were validated using a clinical database of childhood cancer patients and combined with data from the National Register of Hospitalised Patients and with data from death certificates. These validated data were used to establish cancer incidence. Data from death certificates were used to evaluate long-term trends in mortality. Incidence and mortality trends were assessed by the average annual percentage change.
Results: The age-standardised incidence trend for childhood cancers (i.e. those diagnosed in patients aged 0–19 years) showed a statistically significant slight long-term increase in the number of new cases, +0.5% annually on average (p < 0.01), more specifically an increase of +0.6% in girls and a statistically insignificant decrease of −0.1% in boys. In children aged 0–14 years, other malignant epithelial neoplasms and malignant melanomas showed the largest statistically significant average annual increase in incidence (+4.9%; p < 0.01), followed by central nervous system neoplasms (+1.3%; p < 0.05). Lymphomas, by contrast, showed a statistically significant average annual decrease in incidence in children aged 0–14 years (−2.1%; p < 0.01). In adolescents aged 15–19 years, other malignant epithelial neoplasms and malignant melanomas also showed a statistically significant average annual increase in incidence (+5.2%; p < 0.01), followed by central nervous system neoplasms (+1.5%; p < 0.05). Mortality trends showed a statistically significant long-term decrease: on average, −5.1% annually in children aged 0–14 years (p < 0.01), and −3.7% annually in adolescents aged 15–19 years (p < 0.01).
Conclusion: Available data make it possible to analyse long-term trends in childhood cancer incidence and mortality.
Keywords:
mortality – incidence – body mass index – cancer – Adolescents – time trend
Introduction
Based on data from the Czech National Cancer Registry, which were validated using clinical data from participating childhood cancer centres, data from the National Register of Hospitalised Patients and data from death certificates, our study aimed to evaluate incidence and mortality trends for cancers diagnosed in children (aged 0–14 years) and in adolescents (aged 15–19 years) in the period 1994–2016 in the Czech Republic.
Available data on childhood and adolescent cancers in the Czech Republic
High-quality data play a key role in the assessment of epidemiology of childhood and adolescent cancers. In particular, the following data sources are used for this purpose in the Czech Republic:
Czech National Cancer Registry (CNCR) – a nationwide population-based registry into which new cancer cases are recorded and followed up regularly. Cancer registration is enshrined in Czech legislation and is obligatory [1];
Clinical databases of childhood cancer patients – internal databases maintained in two major centres providing care to childhood cancer patients (the Department of Paediatric Haematology and Oncology at the University Hospital in Motol and the Department of Paediatric Oncology at the University Hospital Brno). These databases contain basic diagnostic and clinical data on childhood cancer patients; data from the period 1994–2016 were available at the time of our analysis [2];
National Registry of Hospitalised Patients (NRHOSP) – a nationwide population-based registry containing records on persons who were hospitalised in inpatient wards, and who were discharged from hospital in the monitored period [3]. NRHOSP was used to look up more recent data from the years 2015 and 2016;
Death certificate – the basic source of information on each death. The examining physician fills the certificate immediately after his/her examination of the deceased person. Apart from the basic sociodemographic characteristics, the physician also records the succession of causes leading to death (coded by ICD-10); the evaluated data were last updated on 31 December 2016 [4];
Demography of the Czech Republic – all demographic data on the population of interest in the period 1994–2016 were drawn from data provided by the Czech Statistical Office (CZSO) [5].
Data on childhood cancers, which are recorded in the Czech National Cancer Registry, were validated using a clinical database of childhood cancer patients and subsequently combined with data from the National Register of Hospitalised Patients and with data from death certificates. These combined data were used to establish cancer incidence. Data from death certificates were used to determine long-term mortality trends in the period 1994–2016.
Methods
The cancers were classified into groups according to the International Classification of Childhood Cancer (ICCC) [6]. Malignant neoplasms (cancers) were defined as those belonging to all diag-nostic groups (I–XII) in the ICCC classification with behaviour code 3, plus those belonging to diagnostic groups III (central nervous system (CNS) and miscellaneous intracranial and intraspinal neoplasms) and Xa (intracranial and intraspinal germ cell tumours) with behaviour code 0/1. Incidence is the number of new cases diagnosed in a given period in a given population. Mortality is the number of deaths from a given diagnosis (so-called cause-specific mortality) occurring in a given period in a given population. Crude incidence (or crude mortality) is the number of new cases arising (or deaths occurring) per 1 million persons in a given population; depending on the context, the number of persons is equal to the entire population of children and adolescents aged 0–19 years, children aged 0–14 years, adolescents aged 15–19 years, only boys or only girls in a given age group. Age-standardised incidence rate (or age-standardised mortality rate) (ASR) – is the weighted mean of crude incidence (or mortality) rates in age categories, with weights of crude rates in individual age categories being proportional to the number of persons in a standard population. In other words, ASR is the number of new cases (or deaths) per 1 million persons if the population of interest had the same age structure as the standard population. In our calculations, we used the world standard population (W) [7], i.e. a theoretical population for which the percentages of persons in individual age categories correspond approximately to a given real population. The joinpoint regression method [8] was used to evaluate incidence and mortality trends; the joinpoint regression model assumes that its regression mean function is piecewise linear and the segments (with different gradients) are continuously connected at several time points, which are generally unknown. Apart from the obtained curve, the average annual percentage change (AAPC) is an important result of this method. If any joinpoints occur, the annual percentage change (APC) for a given period can be evaluated, supplemented with statistical significance and confidence intervals. The IBM SPSS Statistics 25 software was used to carry out the analysis. The Joinpoint Regression Program (version 4.6) [9] was used as a specialised software to calculate the joinpoint regression.
Results
Demography
According to the CZSO data, there were 10,565,284 people living in the Czech Republic on 1 July 2016. The population age structure revealed that a total of 1,635,342 children aged 0–14 years and 458,382 adolescents aged 15–19 years lived in the Czech Republic at that time; the population of interest therefore comprised a total of 2,093,724 persons aged 0–19 years, accounting for approximately 20% of the total population. Although a steady decline in the number of children aged 0–19 years was observed in the Czech Republic from 1994 onwards, a slight increase in the number of both boys and girls was observed in 2015–2016. The percentages of age groups < 1 year and 10–14 years was virtually unchanged in the period 1994–2016, whereas the percentages of children aged 1–4 years and 5–9 years increased slightly and the percentage of adolescents aged 15–19 years decreased steadily. The ratio of boys to girls has not changed in the period of interest (there were 51.3% boys and 48.7% girls in 2016).
Current epidemiological trends for childhood and adolescent cancers in the Czech Republic
A total of 9,435 children and adolescents under the age of 19 were diag-nosed with cancer in the period 1994–2016, i.e. 410 cases annually on average (274 cases in children aged under 14 and 136 cases in adolescents). The age group distribution was as follows: < 1 year (6.7%), 1–4 years (22.8%), 5–9 years (17.2%), 10–14 years (20.1%) and 15–19 years (33.2%). Despite minor fluctuations, cancer incidence in absolute numbers decreased steadily until 2007 and could be considered as stable from that time until 2016. The incidence rate per 1 million children, however, had a slightly increasing trend in the entire period of interest, apart from the stabilisation in the most recent years. A total of 378 cases were newly diagnosed in the Czech Republic in 2016, corresponding to 181 cases per 1 million children (183 cases in girls, i.e. 180 cases per 1 million girls, and 195 cases in boys, i.e. 185 cases per 1 million boys). In the period 1994–2016, incidence was somewhat higher in boys than in girls in both age groups of interest: 0–14 years (boys/girls ratio 1.2; p < 0.01) and 15–19 years (1.1; p < 0.05). The higher incidence of cancer in boys aged 0–14 years, as compared to girls in the same age group, is due to a markedly higher incidence of lymphomas (ICCC Group II). The numbers of cases annually and crude incidence rates by ICCC groups, sex and age in the period 1994–2016 are given in Tab. 1.

The most common childhood and adolescent cancers affecting the age group of < 19 years in the Czech Republic in the period 1994–2016 involved leukaemia, which accounted for almost 1 in 4 of all cases, followed by CNS neoplasms (18.0%) and lymphomas (16.8%). Other malignant epithelial neoplasms and malignant melanomas also contributed significantly to the incidence of childhood and adolescent cancers (12%). Leukaemia (29.2%) and CNS neoplasms (21.8%), followed by lymphomas (21.8%), were the most common cancers in children aged 0–14 years, whereas lymphomas (25.8%), other malignant epithelial neoplasms and malignant melanomas (25.0%) and germ cell tumours, trophoblastic tumours and neoplasms of the gonads (14.0%) were the most common cancers in adolescents aged 15–19 years, as shown in Tab. 1.
The age-standardised incidence trend for childhood cancers (i.e. those diag-nosed in patients aged 0–19 years) showed a statistically significant long-term slight increase in the number of new cases, +0.5% annually on average (95% CI +0.2, +0.8; p < 0.01) (ASR-W: 184 cases per 1 million children in 2016), namely an increase of +0.6% in girls (95% CI +0.3, 1.0; p < 0.01) and a statistically insignificant decrease of −0.1% in boys (95% CI −2.3, +2.1; p = 0.93). The incidence trend for solid tumours in patients aged 0–19 years in the Czech Republic showed a statistically significant increase in the number of new cases annually, +1.4% on average (95% CI +1.0, +1.8; p < 0.01), in the entire period 1994–2016 (ASR-W: 119 cases per 1 million children in 2016). By contrast, the incidence trend for malignant neoplasms of the lymphoid and haematopoietic tissue showed a statistically significant slight decrease in the number of new cases, −0.8% annually on average (95% CI −1.4; −0.3; p < 0.01) (ASR-W: 65 cases per 1 million children in 2016), as shown in Graph 1.
ASR-W – age-standardised incidence rate – world standard population, AAPC (95% CI) – average annual percentage change (95% confidence interval)
** p-value < 0.01

The largest statistically significant average annual increase in incidence was observed in the group of other malignant epithelial neoplasms and malignant melanomas (+5.1%; 95% CI +4.0, +6.3; p < 0.01) (ASR-W: 28 cases per 1 million children in 2016), followed by CNS neoplasms (+1.4%; 95% CI +0.4, +2.4; p < 0.01) (ASR-W: 38 cases per 1 million children in 2016). By contrast, a statistically significant average annual decrease in incidence was observed in lymphomas (−1.5%; 95% CI −2.5, −0.5; p < 0.01) (ASR-W: 26 cases per 1 million children in 2016). A statistically significant average annual decrease in incidence of germ cell tumours, trophoblastic tumours and neoplasms of the gonads was only observed in girls (−3.3%; 95% CI −5.9, −0.7; p < 0.05) (ASR-W: 5 cases per 1 million girls in 2016). Let us examine the main subgroups of the most important ICCC groups in more detail:
ICCC Group II: The incidence trend for Hodgkin’s lymphoma showed a statistically significant slight decrease over the entire period 1994–2016, −1.4% annually on average (95% CI −2.4, −0.4; p < 0.01) (ASR-W: 13 cases per 1 million children in 2016). The incidence trend for non-Hodgkin’s lymphoma also showed a statistically significant decrease in the number of new cases, −2.3% annually on average (95% CI −3.5, −1.0; p < 0.01) (ASR-W: 7 cases per 1 million children in 2016). The opposite was observed in the incidence trend for Burkitt lymphoma, which showed a statistically significant increase, +3.3% annually on average (95% CI +0.5, +6.2; p < 0.05) (ASR-W: 4 cases per 1 million children in 2016).
ICCC Group III: The incidence trend for astrocytomas showed a statistically insignificant slight increase over the entire period 1994–2016, +0.2% annually on average (95% CI −1.1, +1.5; p = 0.73) (ASR-W: 20 cases per 1 million children in 2016), and a similar trend was observed for ependymomas and choroid plexus tumours, i.e. an insignificant slight increase in incidence, +0.5% annually on average (95% CI −1.9, +3.0; p = 0.68) (ASR-W: 2 cases per 1 million children in 2016). The incidence trend for intracranial and intraspinal embryonal tumours, however, showed a statistically significant increase in the number of new cases, +2.1% annually on average (95% CI +0.5, +3.6; p < 0.05), (ASR-W: 8 cases per 1 million children in 2016).
ICCC Group XI: Incidence trends for other and unspecified carcinomas, thyroid carcinomas and malignant melanomas all showed statistically significant average annual increases over the entire period 1994–2016, namely +4.9% in other and unspecified carcinomas (95% CI +2.9, +7.0; p < 0.01) (ASR-W: 9 cases per 1 million children in 2016), of 6.5% in thyroid carcinomas (95% CI +4.5, +8.5; p < 0.01) (ASR-W: 8 cases per 1 million children in 2016) and of 5.1% in malignant melanomas (95% CI +2.6, +7.7; p < 0.01) (ASR-W: 7 cases per 1 million children in 2016).
According to available data, cancer incidence had a stable trend in children aged 0–14 years (AAPC = +0.2%; 95% CI −0.2, +0.6; p = 0.34) (ASR-W: 173 cases per 1 million children in 2016), unlike cancer incidence in adolescents aged 15–19 years, which showed a statistically significant long-term increase in the number of new cases, +1.0% annually on average in boys (95% CI +0.2, +1.7; p = 0.02) (crude incidence: 225 cases per 1 million boys in 2016), and even +1.7% in girls (95% CI +0.9, +2.5; p < 0.01) (crude incidence: 215 cases per 1 million girls in 2016).
Trends in cancer incidence in children aged 0–14 years
The incidence trend for leukaemia can be considered as stable since 1996 (age-standardised incidence: 42 cases per 1 million children in 2016). The incidence of lymphomas showed a statistically significant decrease, −2.1% annually on average (95% CI −3.5, −0.7; p < 0.01) (ASR-W: 17 cases per 1 million children in 2016), whereas CNS neoplasms showed the opposite trend, i.e. a statistically significant average annual increase of +1.3% (95% CI +0.2, +2.5; p < 0.05) (ASR-W: 43 cases per 1 million children in 2016). The incidence of other malignant epithelial neoplasms and malignant melanomas grew significantly, +4.9% annually on average (95% CI +3.4, +6.4; p < 0.01) (ASR-W: 16 new cases per 1 million children in 2016).
Trends in cancer incidence in adolescents aged 15–19 years
The incidence trend for leukaemia showed a slight but statistically insignificant increase, +1.0% annually on average (crude incidence: 31 cases per 1 million children in 2016). The incidence of lymphomas showed an average annual decrease of 0.8%, which, however, was statistically insignificant (crude incidence: 55 cases per 1 million children in 2016). By contrast, CNS neoplasms showed the opposite trend, i.e. a statistically significant average annual increase of +1.5% (95% CI +0.1, +2.9; p < 0.05) (crude incidence: 20 cases per 1 million children in 2016). The incidence of other malignant epithelial neoplasms and malignant melanomas grew significantly, +5.2% annually on average (95% CI +3.8, +6.7; p < 0.01) (crude incidence: 70 cases per 1 million children in 2016).
Incidence trends and the AAPC for the four most common ICCC groups diagnosed in children and adolescents, according to age and sex, are described in Tab. 2.

*p-value < 0.05, **p-value < 0.01
NA – AAPC could not be estimated reliably because N = 0 was reported in at least 1 year from the follow-up period; AAPC was calculated
from the age-standardised incidence rate for children aged 0–14 years and for the entire group (0–19 years); AAPC was calculated
from the crude incidence rate for adolescents aged 15–19 years.
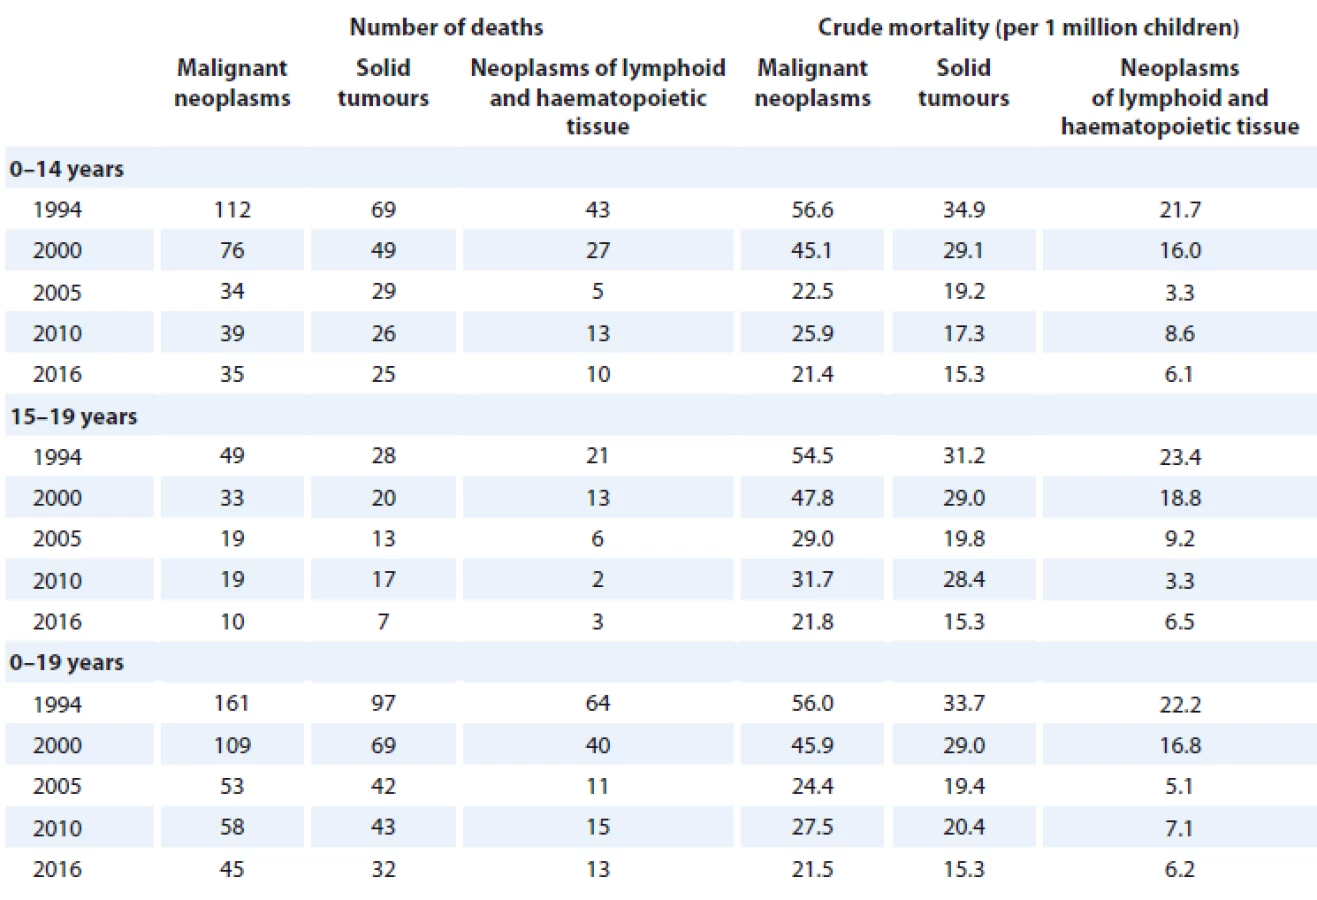
Cancer mortality in patients aged 0–19 years decreased over the entire period 1994–2016, both in absolute numbers and calculated per 1 million children. Mortality was mostly higher in boys than in girls (both in absolute numbers and calculated per 1 million persons) – except the most recent year, when girls had a higher mortality than boys. There were 161 cancer deaths in children in the Czech Republic in 1994, i.e. 56 deaths per 1 million children. By contrast, there were only 45 cancer deaths in children in the Czech Republic in 2016, corresponding to 22 deaths per 1 million children (25 deaths in girls, i.e. 25 deaths per 1 million girls, and 20 deaths in boys, i.e. 19 deaths per 1 million boys). The numbers of deaths and crude mortality rates for malignant neoplasms, solid tumours and neoplasms of the lymphoid and haematopoietic tissue, according to age and selected years from the period 1994–2016, are given in Tab. 3.
Malignant neoplasms of the brain, spinal cord and other parts of the CNS (C70–C72) were the most common causes of cancer deaths in patients aged 0–19 years in the Czech Republic in the period 1994–2016, followed by leukaemia (C91–C95) and then by less common neoplasms, namely malignant neoplasms of the bone and articular cartilage (C40–C41), malignant neoplasms of the connective and soft tissue (C47, C49) and non-Hodgkin’s lymphoma (C82–C86). The age group distribution was as follows: < 1 year (4.6%), 1–4 years (19.2%), 5–9 years (21.4%), 10–14 years (22.0%) and 15–19 years (32.8%). In the period 1994–2016, malignant neoplasms of the brain, spinal cord and other parts of the CNS were the most common causes of cancer deaths in children aged 0–14 years (accounting for more than 1 in 3 cancer deaths in this age group), followed by leukaemia (23.4%) and malignant neoplasms of the connective and soft tissue (9.1%). Leukaemia (23.9%), followed by malignant neoplasms of the brain, spinal cord and other parts of the CNS (18.9%) and malignant neoplasms of the bone and articular cartilage (15.9%) were the most common causes of cancer deaths in adolescents aged 15–19 years. Malignant neoplasms of the brain, spinal cord and other parts of the CNS remained the most common causes of cancer death in children aged 0–14 years of the entire period of interest. In adolescents aged 15–19 years, leukaemia was the most common causes of cancer deaths until 2010, when it was replaced by malignant neoplasms of the brain, spinal cord and other parts of the CNS in the more recent period (2011–2016), as shown in Graph 2.

The age-standardised mortality trend for childhood cancers (i.e. those diag-nosed in patients aged 0–19 years) showed a statistically significant long-term decrease in the number of deaths, −4.7% annually on average (95% CI −5.3, −4.1; p < 0.01) (ASR-W: 21.5 deaths per 1 million children in 2016), more specifically −5.1% annually in boys (95% CI −5.8, −4.3; p < 0.01) (ASR-W: 19 deaths per 1 million boys in 2016) and −4.1% annually in girls (95% CI −5.1, −3.2; p < 0.01) (ASR-W: 25 deaths per 1 million girls in 2016). The mortality trend for solid tumours in patients aged 0–19 years in the Czech Republic showed a statistically significant decrease in the entire period 1994–2016, −3.8% annually on average (95% CI −4.4, −3.2; p < 0.01) (ASR-W: 15 deaths per 1 million children in 2016). The mortality trend for malignant neoplasms of the lymphoid and haematopoietic tissue showed a similar situation, i.e. a statistically significant long-term decrease in the number of deaths, −6.5% annually on average (95% CI −7.9, −5.1; p < 0.01) (ASR-W: 6 deaths per 1 million children in 2016), as shown in Graph 3.
ASR-W – age-standardised mortality rate – world standard population, AAPC (95% CI) – average annual percentage change (95% confidence interval)
** p-value < 0.01

The mortality trend for childhood cancers showed a statistically significant long-term decrease in both age groups of interest: −5.1% annually on average in children aged 0–14 years (95% CI −5.7, −4.4; p < 0.01) (ASR-W: 21 deaths per 1 million children in 2016) and −3.7% annually on average in adolescents aged 15–19 years (95% CI −4.8, −2.6; p < 0.01) (crude mortality: 22 deaths per 1 million adolescents in 2016). Mortality trends and the AAPC for malignant neoplasms, solid tumours and neoplasms of the lymphoid and haematopoietic tissue, according to age and sex, are described in Tab. 4. Please note that over the entire period 1994–2016, the mortality trend for solid tumours in boys aged 15–19 years in the Czech Republic showed a statistically significant decrease in the number of deaths, −4.0% annually on average (95% CI −5.3, −2.7; p < 0.01), whereas an average annual increase of +0.6% was shown in girls (95% CI −1.8, +3.1); this increase, however, was statistically insignificant.

**p-value < 0.01
NA – AAPC could not be estimated reliably because N = 0 was reported in at least one year from the follow-up period; AAPC was
calculated from the age-standardised mortality rate for children aged 0–14 years and for the entire group (0–19 years); AAPC was
calculated from the crude mortality rate for adolescents aged 15–19 years.
Discussion
In the period 1994–2016, the age-standardised incidence trend for childhood cancers (i.e. those diagnosed in patients aged 0–19 years) in the Czech Republic showed a statistically significant increase in the number of new cases, +0.5% annually on average (95% CI +0.2, +0.8; p < 0.01); this is comparable to trends in the US, where cancer incidence in patients under 20 years of age grew +0.6% annually on average (p < 0.05) in the period 1975–2014 [10]. When comparing European countries, the Czech Republic has one of the highest incidence rates of cancer diagnosed in children aged 0–19 years. The age-standardised (world) incidence rate per 1 million children in the Czech Republic (173.5 in the period 1990–2012) is similar to that in Portugal, for example (173.8; 1991–2012). The highest incidence has been reported in Belgium (211.1; 2004–2013) and in Italy (206.2; 1992–2013), whereas Bulgaria reported the lowest incidence (124.6; 1990–2013) [11].
The trend in age-standardised incidence of cancer diagnosed in children aged 0–14 years in European countries (39 registries from 19 countries in total) has seen a statistically significant increase in the period 1991–2010 (+0.54%; 95% CI +0.44; +0.65) [12]. A similar trend – but of borderline significance – was observed in the Czech Republic in the period 1994–2014 (+0.6%; 95% CI 0.01; 1.12) [13]. In the period 1994–2016, however, the incidence of childhood cancer in the Czech Republic already had a stable trend (+0.2%; 95% CI –0.2; +0.6; p = 0.34). In children aged 0–14 years, other malignant epithelial neoplasms and malignant melanomas showed the largest statistically significant average annual increase in incidence (+4.9%; 95% CI +3.4, +6.4; p < 0.01), followed by CNS neoplasms (+1.3%; 95% CI +0.2, +2.5; p < 0.05). Studies published in recent years also reported a significant increase in the incidence of these two cancer groups: in Austria, for example, the incidence of CNS neoplasms increased +2.9% annually on average (95% CI +0.9, +5.0; p < 0.01) in the period 1994–2011, and an average annual increase of +1.8% (95% CI +0.6, +3.1; p < 0.05) in the incidence of CNS neoplasms was observed in Italy in the period 1988–2008; a significant increase in the incidence of other malignant epithelial neoplasms and malignant melanomas, +4.1% (p < 0.05) was also observed in Italy [14,15]. By contrast, lymphomas in children aged 0–14 in the Czech Republic showed a statistically significant average annual decrease in incidence (−2.1%; 95% CI −3.5, −0.7; p < 0.01); this trend, although statistically insignificant, was also observed in Austria (−0.7%) [14]. Apart from that, the most recent paper by Steliarova-Foucher et al. pointed out a statistically significant decrease in the incidence of lymphomas in Eastern European countries (−1.32%; 95% CI −2.08; −0.56), as opposed to stable trends in Northern, Southern and Western European countries [12]. Similar trends in the incidence of individual cancers diagnosed in children aged 0–14 years in the period 1994–2014 in the Czech Republic were described by Kodytkova et al. [13].
Cancer incidence in Czech adolescents showed a significant long-term increase in the number of new cases in the period 1994–2016: +1.0% annually on average in boys (95% CI +0.2; +1.7; p = 0.02) and even +1.7% in girls (95% CI +0.9; +2.5; p < 0.01). In the period 1991–2010, a significant increase in cancer incidence in adolescents (+0.96%; 95% CI +0.73; +1.19) was reported in other European countries, too (45 registries from 19 countries in total) [12]. In the period 1994–2016, the incidence of other malignant epithelial neoplasms and malignant melanomas in adolescents aged 15–19 years in the Czech Republic grew significantly, +5.2% annually on average (95% CI +3.8, +6.7; p < 0.01), followed by CNS neoplasms, which showed an average annual increase in incidence of +1.5% (95% CI +0.1; +2.9; p < 0.05). An increase in the incidence of malignant melanomas has already been mentioned in the paper by Bajciova et al., which also highlighted the continuously growing trend in cancer incidence in adolescents [16]. In Austria in the period 1994–2011, the average annual increase in the incidence of CNS neoplasms was +5.7% (p < 0.01), whereas the incidence of other malignant epithelial neoplasms and malignant melanomas increased by +2.9% (p < 0.05) annually on average [14]. An increase in the incidence of other malignant epithelial neoplasms and malignant melanomas (+5.3%; 95% CI +3.3, +7.3; p < 0.05) was also observed in Italy in the period 1988–2008 [15].
The mortality trend for solid tumours in patients aged 0–19 years in the Czech Republic showed a statistically significant decrease in the entire period 1994–2016,–3.8% annually on average (95% CI −4.4, −3.2; p < 0.01) and a similar situation was observed in the mortality trend for malignant neoplasms of the lymphoid and haematopoietic tissue, i.e. a statistically significant long-term decrease in the number of deaths, −6.5% annually on average (95% CI −7.9, −5.1; p < 0.01). In the US in the period 1998–2006, the mortality trend for malignant neoplasms of the lymphoid and haematopoietic tissue showed a statistically significant decrease of −2.2% annually on average (95% CI −3.1, −1.2; p < 0.05) in patients under 20 years of age, whereas mortality trends for other malignant neoplasms were stable in the period 1996–2006 (−0.3%; 95% CI −1.1, +0.5) [17].
In the Czech Republic in the period 1994–2016, the mortality trend for childhood cancers showed a statistically significant long-term decrease in both age groups of interest: −5.1% annually on average in children aged 0–14 years (95% CI −5.7, −4.4; p < 0.01) and −3.7% annually on average in adolescents aged 15–19 years (95% CI −4.8, −2.6; p < 0.01). Studies published in recent years also reported a significant decrease in mortality: in Austria in the period 1994–2011, for example, cancer mortality decreased −2.4% annually on average (95% CI −3.7, −1.2; p < 0.001) in children aged 0–14 years and −2.0% (95% CI −4.6, 0.5; p > 0.05) in adolescents [14]; and in Ireland, cancer mortality decreased −2.6% annually on average (95% CI −3.0, −2.1) in boys aged 0–14 years in the period 1964–2013, and −2.9% annually on average (95% CI −3.4, −2.3) in girls aged 0–14 years in the period 1968–2013 [18].
Conclusion
Our study provides the latest and comprehensive information on the development of epidemiological trends for childhood and adolescent cancers in the Czech population. This paper proves the availability of adequate data sources for the above-mentioned analyses.This study was supported by the INTENT and iPAAC research programmes.
The authors declare they have no potential conflicts of interest concerning drugs, products, or services used in the study.
The Editorial Board declares that the manuscript met the ICMJE recommendation for biomedical papers.
RNDr. Denisa Krejčí
Institute of Biostatistics and Analyses
Faculty of Medicine
Masaryk University
Kamenice 753/5
625 00 Brno
e-mail: denisa.krejci@iba.muni.cz
Submitted: 24. 6. 2019
Accepted: 17. 9. 2019
Sources
1. Institute of Health Information and Statistics of the Czech Republic. National Health Information System (NHIS), Czech National Cancer Registry (CNCR). [online]. Available from: http: //www.uzis.cz/en/czech-national-cancer-registry-cncr.
2. Clinical database of childhood cancer patients. [online]. Available from: http: //detskaonkologie.registry.cz/index-en.php.
3. Institute of Health Information and Statistics of the Czech Republic. National Health Information System (NHIS), National Register of Hospitalised Patients (NRHOSP). [online]. Available from: http: //www.uzis.cz/registry-nzis/nrhosp.
4. Institute of Health Information and Statistics of the Czech Republic. National Health Information System (NHIS), Death certificates. [online]. Available from: http: //www.uzis.cz/registry-nzis/list-prohlidce-zemreleho.
5. Czech statistical office. Czech demographic handbook 2016. [online]. Available from: https: //www.czso.cz/csu/czso/czech-demographic-handbook-2016.
6. Steliarova-Foucher E, Stiller C, Lacour B et al. International classification of childhood cancer, third edition. Cancer 2005; 103 (7): 1457–1467. doi: 10.1002/cncr.20910.
7. Doll R, Payne P, Waterhouse JA (eds.). Cancer incidence in five continents. Vol. 1. Geneva: UICC, Berlin: Springer 1966.
8. Boyle P, Parkin DM. Statistical methods for registries. In: Jensen OM, Parkin DM, MacLennan R et al (eds). Cancer registration: principles and methods. Lyon: IARC Scientific Publ 1991 : 126–158.
9. National cancer institute. Division of cancer control & population sciences. Joinpoint Regression Program, Version 4.6.0.0. Statistical Methodology and Applications Branch, Surveillance Research Program. [online]. Available from: https: //surveillance.cancer.gov/joinpoint/.
10. Howlader N, Noone AM, Krapcho M et al (eds.). SEER cancer statistics review (CSR) 1975–2014. Bethesda: National Cancer Institute 2017. [online]. Available from: https: //seer.cancer.gov/csr/1975_2014/.
11. Steliarova-Foucher E, Colombet M, Ries LA et al (eds.). International incidence of childhood cancer, volume III (electronic version). Lyon: International Agency for Research on Cancer. [online]. Available from: http: //iicc.iarc.fr/results/.
12. Steliarova-Foucher E, Fidler MM, Colombet M et al. Changing geographical patterns and trends in cancer incidence in children and adolescents in Europe, 1991–2010 (Automated Childhood Cancer Information System): a population-based study. Lancet Oncol 2018; 19 (9): 1159–1169. doi: 10.1016/S1470-2045 (18) 30 423-6.
13. Kodytkova D, Bajciova V, Krejci D et al. Trends in incidence of childhood cancers in the Czech Republic: population-based analysis of national registries (1994–2014). Neoplasma 2018; 65 (4): 620–629. doi: 10.4149/neo_2018_170517N358.
14. Karim-Kos HE, Hackl M, Mann G et al. Trends in incidence, survival and mortality of childhood and adolescent cancer in Austria, 1994–2011. Cancer Epidemiol 2016; 42 : 72–81. doi: 10.1016/j.canep.2016.03.015.
15. AIRTUM Working Group, CCM, AIEOP Working Group. Italian cancer figures, report 2012: cancer in children and adolescents. Epidemiol Prev 2013; 37 (Suppl 1): 1–225.
16. Bajciova V, Ondercova Z, Kodytkova D. Cancer in adolescents. Klin Onkol 2015; 28 (Suppl 2): 81–90. doi: 10.14735/amko20152S81.
17. Smith MA, Seibel NL, Altekruse SF et al. Outcomes for children and adolescents with cancer: challenges for the twenty-first century. J Clin Oncol 2010; 28 (15): 2625–2634. doi: 10.1200/JCO.2009.27.0421.
18. National Cancer Registry Ireland. Cancer trends 32 – childhood cancer. Childhood cancer trends report February 2017. [online]. Available from: http: //www.ncri.ie/publications/cancer-trends-and-projections/cancer-trends-32-childhood-cancer.
Labels
Paediatric clinical oncology Surgery Clinical oncologyArticle was published in
Clinical Oncology

2019 Issue 6
Most read in this issue
- Extravasation (Paravasation) of Chemotherapy Drugs – Recommendations for Standard Care in the Czech Republic based on Consolations between Representatives of the Supportive Care Group of the Czech Society for Oncology, Oncology Section of the Czech Nurses Association, and the Society for Ports and Permanent Catheters
- Rare Hereditary Burden associated with a Hypercalcemic Small-Cell Carcinoma of Cervix in a Young Female Patient
- Tranzice péče o onkologické pacienty z dětského do dospělého věku
- Bortezomib and Thalidomide Treatment Results in Newly Diagnosed Transplant-Ineligible Multiple Myeloma Patients are Comparable in Long-Term Follow-Up