
Methods evaluating upper arm and forearm movement during a quiet stance
Authors:
Petr Volf 1; Patrik Kutilek 2; Jan Hejda 1; Rudolf Cerny 3; Iva Milerska 4; Karel Hana 5
Authors‘ workplace:
Department of Biomedical Technology, Faculty of Biomedical Engineering, Czech Technical University in Prague, Kladno, Czech Republic
1; Department of Natural Science, Faculty of Biomedical Engineering, Czech Technical University in Prague, Kladno, Czech Republic
2; University Hospital Motol – 2nd Faculty of Medicine, Charles University in Prague, Prague, Czech Republic
3; Czech Institute of Informatics, Robotics and Cybernetics, Czech Technical University in Prague, Prague, Czech Republic
4; Department of Information and Communication Technologies in Medicine, Faculty of Biomedical Engineering, Czech Technical University in Prague, Kladno, Czech Republic
5
Published in:
Lékař a technika - Clinician and Technology No. 2, 2019, 49, 58-65
Category:
Original research
Overview
The article focuses on designing methods for quantitative assessment of the postural stability in a quiet stance by measuring segments of the appendicular skeleton, namely upper and forearms by inertial measurement units (IMU). Although an array of quantitative analysis methods assessing data of postural stability in the quiet stance exist by measuring the head and trunk movement, these methods have not been used to date to assess the behavior of appendicular skeleton segments, namely the upper limbs. The applicability of methods assessing arm movement during the quiet stance has been verified by comparing the values of healthy subjects performing various stance tasks. The tests determined the quantitative evaluation of acceleration measured on individual anatomical axes. The quantities included: the volume of a convex polyhedron (PV), the volume of confidence ellipsoid (EV) and average velocity (AV) obtained by plotting three accelerations against each other. The most important findings in this study concern significant differences of PV and AV between dominant and non-dominant upper extremities and significant differences of EV, PV and AV between the data measured with a subject's eyes closed and open. Higher values of indicators were in the non-dominant extremities when subjects were measured with closed eyes. Statistically significant differences between dominant and non-dominant arm movements were documented in PV and AV cases. This is due to the PV calculation being more sensitive to random deviations, i.e. the range of measured data, since the polyhedron bounds all the measured data, as opposed to the method, where the ellipse bounds only 95% of the measured data. In the case of the AV method, it is due to higher sensitivity to movements corresponding with arm tremors; the AV calculation relates not only to the range of measured data but, above all, to the intensity of data changes in the segment measured in a particular space and time interval. These conclusions demonstrate that it is possible to apply the proposed methods in the assessment of arm movement during a quiet stance since the differences between individual stance tasks and the dominant and non-dominant arms in specific cases of quiet stance have been identified. These conclusions also indicate a potentially more extensive medical application of the proposed quantitative data evaluation obtained from IMU, for example, within the rehabilitation process of injured appendicular skeleton segments. The use of cheaper IMU methods in mobile phones or watches can be of significant benefit in measuring the segmental movement of the appendicular skeleton in quiet stance. The methods outlined in this paper have potential in the field of telemedicine.
Keywords:
accelerometer – upper arm – quiet stance – postural stability – convex polyhedron – confidence ellipsoid
Introduction
The movements and positions of body segments can be negatively influenced by many diseases of the musculoskeletal or nervous system [1]. Subjects with some of these disorders usually show instability during stance tasks. The Romberg's test has become the standard approach to evaluating postural instability during quiet standing [2]. Making the stance task more difficult by removing visual proprioception is consid-ered a means to identify and quantitatively evaluate the movement of patients with a disease [3]. Recently, cheaper inertial measurement units (IMU), i.e. elec-tronic devices based on accelerometers and gyroscopes, were used for high-accuracy measurement of human body segments during a quiet stance, instead of the commonly used stabilometric platforms, which are traditionally used to study postural stability during quiet stance [4]. The sensing IMUs can be used to measure the accelerations of body segments on which the IMUs are placed. In the past, these sensing units were placed on the trunk or head to measure the motion of these segments during a quiet stance and to identify any impaired balance control [5]. To monitor and train a posture, a non-commercial IMU system, a diagnostic tool for trunk movement, has been developed; in this way, non-expensive accelerometers and gyroscopes used in modern cell phones and electronic watches have further potential for monitoring posture. Traditional and more complex methods for processing measured data and assessing postural instability use at least two measured variables; these methods are based on the convex hull [6], confidence ellipse [7], or length of trajectory obtained by plotting two variables against each other [8]. These methods are used to evaluate data obtained from the force platform [9], or an IMU system placed on a segment of the axial skeleton.
Although IMUs and the above mentioned quantitative evaluation methods were experimentally used to assess postural stability by measuring the movement of the axial skeleton segments, there is no evidence demon-strating that the methods mentioned above are also able to assess the behaviour of segments of the appendicular skeleton during quiet stance. It is evident however that the data obtained from measured segments of the appendicular skeleton in a quiet stance may contribute to the identification of specific disorders of the musculoskeletal or nervous system. Specifically, the data processing methods from less expensive IMUs in mobile phones or watches may be beneficial in mea-suring the movement of segments of the appendicular skeleton during a quiet stance, for example, within the telemedical domain. This study aims to propose or adjust existing methods of quantitative evaluation of IMU motion data to measure the movement of the upper limbs, as parts of the appendicular skeleton. The methods have been tested on healthy subjects measured during two different stance tasks so that changes in postural stability can be observed. Relationship between variables have been tested to find out whether the proposed methods lead to identical conclusions and are substitutable in future commercial systems in clinical practice. The second objective of healthy subjects´ measuring is to determine whether the proposed methods can identify any differences between the movement of segments of the appendicular skeleton during a quiet stance, i.e. the differences in a movement of the dominant and non-dominant upper limb, i.e. forearms and upper arms. These findings are expected to become beneficial in more extensive medical applications in the future, for example, within the rehabilitation process of injured segments of the appendicular skeleton, and in more inexpensive IMUs applications in the wider medical practice.
Methods
Participants
Ten volunteers (aged 22 (SD 0.5) years of age, body weight 71 (SD 12) kg; height 176 (SD 8) cm). All the participants (healthy subjects) were recruited from the students of the Czech Technical University in Prague. Thus, data were measured on ten subjects, where each sample of data is of size ten. The Edinburgh Handedness Inventory was used to assess the dominance of a person's right or left hand [10]. The study involved one weak left-hander (handedness -9%) and nine right-handers (from weak (11%) to strong handedness (100%)). The mean handedness score of the group was 49% (SD=31%). The diagnostic evaluation included a detailed medical history, and informed consent was obtained from all the subjects. The dominant and non-dominant hand of each participant was identified, and arm motions were recorded. The study was performed in agreement with the Helsinki Declaration. All participants for measure-ment were selected randomly on different days.
Test procedure and measurement equipment
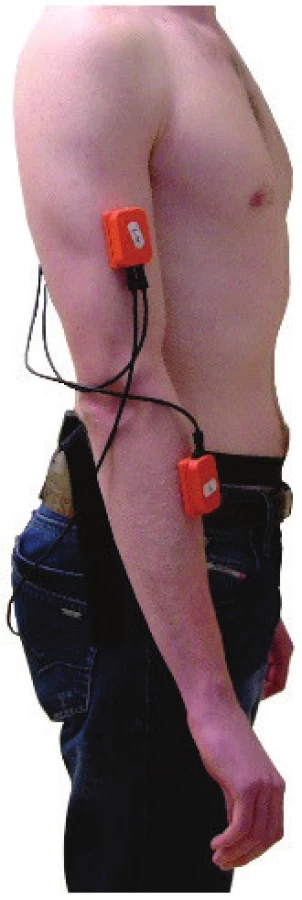
The Xbus Master (Xsens Technologies B.V.), is a lightweight (330 g) portable device using MTx units for orientation and acceleration measurement of body segments (see Fig. 1). It was used to measure dominant and non-dominant arm movements. The MTx unit with an embedded accelerometer and gyroscope is an accurate IMU measuring drift-free 3-D orientation and 3-D acceleration. The MTx unit was calibrated before each clinical examination. The MTx unit was set up in the following way: one axis of the MTx's coordinate system was parallel to the anterior-posterior axis (i.e. the symmetry axis of the fixed stationary platform on which the participants stood). The other two axes were perpen-dicular to the anterior-posterior axis (i.e. symmetry axis of the platform) respecting the Earth's gravitational direction, i.e. vertical axis was co-linear with the direction of gravity. After calibration, the MTx units were placed on the patient's upper extremities, according to [11, 12] and following the MoCap system manufacturer's recommendations, [12]. Four MTx units were placed on the dorsal sides of arms close to the segments' centre without interfering with the motion of the upper extremities or trunk.
The data, i.e. the three Euler angles (roll (Φ), yaw (Ψ), pitch (Θ)) [13–15], and three orthogonal accelerations (aSx, aSy, aSz) in the accelerometer coordinate system [16] were measured by each MTx unit placed on the arm while subjects were in quiet standing on a fixed stationary platform. Conventions of Euler angles are described in [14, 15, 17] and were used to interpret the data. The three accelerations measured by the MTx accelerometer unit were described previously in [18, 19]. The movements of both arms were measured by the Xsens system during quiet stance (i.e. Romberg's test) on a firm surface with eyes open (EO) and then eyes closed (EC) [20]. The subject's bare feet were positioned next to each other, splayed at a 30º angle, arms were in a neutral hanging position. The tasks included stand-
ing on both feet for at least 60 seconds [21]. The measurements usually lasted a few seconds longer, and the initial data has been shortened, so that all datasets had a record length of 60 seconds. The Xsens system measures accelerations in 3-D space with the noise of 0.002 m·s-2·Hz-0.5 and the data was recorded at the sample frequency of 100 Hz.
Method of data processing
Three orthogonal accelerations and three Euler angles were recorded continuously during the testing trial using each MTx unit. In this way, a set of instantaneous values were obtained by four MTx units, two placed on each arm. The instantaneous values of the three Euler angles and three accelerations in the accelerometer coordinate system of each MTx unit were used to calculate the accelerations in the global reference system and sub-sequently, in the anatomical coordinate frame. The calculation was based on the rotational matrices,
see [22, 23]. The calculated acceleration vector of the instantaneous accelera-tions represents the superior-inferior acceleration (aSIi), medio-lateral acceleration (aMLi) and anterior-posterior acceleration (aAPi). The acceleration was recorded continuously during the whole measurement.
Using the accelerations derived, the arm's 3-D movement is possible to evaluate. The calculated accel-eration vectors, or in other words, time dependent data (aSI, aML, aAP) obtained by the three axis accelerometer were plotted as a 3-D plot, i.e. set of points was obtained by plotting the three accelerations against each other, see Fig. 2. The number of points was determined by the time of measurement, i.e. recorded dataset length (60 s) and the sampling frequency (100 Hz).

To evaluate the time dependent data, three methods are suggested. The set of data to test the applicability of the volume of a convex polyhedron (PV), the volume of confidence ellipsoid (EV) and average velocity (AV) for quantitative evaluation of the human arm movement during quiet stance was measured. The methods are based on the EV, PV and AV set of the point obtained by plotting the three accelerations against each other. The EV is based on the mathematical tools for static posturography employed to analyze body sway [24]. In the case presented, the distribution of the measured 3-D data was modelled by 3-D ellipsoid and its volume [7]. The volume of an ellipsoid was given by an ellipsoid matrix and the ellipsoid matrix was composed of entries from the covariance matrix [25]. A 95% confidence ellipsoid was used to test the applicability of 3-D confidence ellipsoid [26]. The 95% confidence ellipsoid volume is the volume of an ellipsoid that is expected to bound 95% of the measured data, i.e. set of points is obtained by plotting three accelerations against each other. The calculation of the EV is described in detail in [7]. In the case described, the distribution of the measured 3-D data was modelled by a 3-D ellipsoid. EV was measured in m3·s-6.
The second method is based on the distribution of the measured 3-D data modelled by a 2-D convex hull or a 3-D convex polyhedron [27]. In mathematics, the convex hull or polyhedron is a set of points in Euclidean space that is the smallest convex set that contains all points [28, 29]. Thus the convex polyhedron is the smallest convex region enclosing all points in the set. The volume of the convex polyhedron can be used to describe the measured distribution of 3-D data. Since no method of calculating the convex polyhedron volume [30, 31] is known, an equation for calculating the volume of any polyhedron described in [32] was employed. PV was measured in m3·s-6.
The third method is based on the average velocity of the point obtained by plotting measured variables against each other [8]. To calculate the average velocity, the total trajectory length of the plot of variables is used [33, 34]. The formulas, used to calculate the trajectory length, are based on the sum of Euclidean distances between consecutive data points in Euclidean 3-D space, as described in [35]. AV is measured in m·s-2. A custom-designed MatLab program based on the functions of the MatLab software (MatLab R2010b, Mathworks, Inc., Natick, MA, USA) was used to calculate the EV, PV, and AV of the 3D plots.
Statistical analysis
After calculating the EV, PV and AV of the measured values of acceleration from the four MTx, the units were divided into two sets; one included accelerations measured on the dominant hand, the second on the non-dominant hand. The data sets were divided into data subsets according to whether the subjects were standing with EO or EC. The Jarque-Bera test was used to identify a normal distribution of calculated median accelerations and maximum accelerations in the data subsets. The median (Mdn), minimum (Min), maximum (Max), the first quartile (Q1) and the third quartile (Q3) of the accelerations were then used to compare results. The Wilcoxon test assessed the significance of the differences between the measured results by the MTx units placed on the dominant and non-dominant arms, as well as the differences between the measured results with EO and EC. The significance level for the evaluation of whether the proposed EV, PV and AV are suitable for the study, was set at p<0.05. In addition, effect sizes, taking into account differences between the two groups of data, were calculated in accordance with [36, 37].
The Spearman's rank correlation coefficients between the data subsets were calculated to identify the relation-ship between EVs, PVs and AVs. The correlation is an effect size allowing for a verbal description of the strength of the correlation between EVs, PVs and AVs
values using the following guide for the absolute value of: 0.00–0.19 (very weak), 0.20–0.39 (weak), 0.40–0.59
(moderate), 0.60–0.79 (strong) and 0.80–1.0 (very strong). The statistical analysis was performed by MatLab software.
Results
The statistical data illustrate the differences between the EVs, PVs and AVs of the dominant and non-dominant arms of the subjects standing with EO and EC. The following plots (Fig. 3, Fig. 4 and Fig. 5) and tables (Table 1 and Table 2) display the Min, Max, Mdn, Q1, and Q3 for the calculated values of EVs, PVs and AVs. Since some of the calculated values were not distributed as expected, the Wilcoxon test was used to compare and analyse the sets of calculated EVs, PVs and AVs.


Table 1: Comparison of the ellipsoid volumes, poly-hedron volumes and average velocities of dominant and non-dominant forearms.
|
|
|
EO D |
EO N |
EC D |
EC N |
|
EV |
Min (m3·s-6) |
2.00·10-4 |
3.00·10-4 |
3.00·10-4 |
3.00·10-4 |
|
Max (m3·s-6) |
1.20·10-3 |
1.30·10-3 |
1.70·10-3 |
1.60·10-3 |
|
|
Mdn (m3·s-6) |
6.00·10-4 |
5.50·10-4 |
8.00·10-4 |
8.00·10-4 |
|
|
Q1 (m3·s-6) |
4.00·10-4 |
4.75·10-4 |
7.00·10-4 |
5.75·10-4 |
|
|
Q3 (m3·s-6) |
9.00·10-4 |
7.75·10-4 |
1.00·10-3 |
1.40·10-3 |
|
|
PV |
Min (m3·s-6) |
5.00·10-3 |
5.00·10-3 |
5.00·10-3 |
6.00·10-3 |
|
Max (m3·s-6) |
2.20·10-2 |
2.90·10-2 |
2.60·10-2 |
3.70·10-2 |
|
|
Mdn (m3·s-6) |
1.60·10-2 |
1.75·10-2 |
2.10·10-2 |
2.05·10-2 |
|
|
Q1 (m3·s-6) |
9.00·10-3 |
1.10·10-2 |
1.40·10-2 |
1.53·10-2 |
|
|
Q3 (m3·s-6) |
1.90·10-2 |
1.98·10-2 |
2.30·10-2 |
2.75·10-2 |
|
|
AV |
Min (m·s-3) |
2.17 |
2.53 |
2.21 |
2.49 |
|
Max (m·s-3) |
3.09 |
3.23 |
3.73 |
3.82 |
|
|
Mdn (m·s-3) |
2.68 |
2.69 |
2.84 |
2.87 |
|
|
Q1 (m·s-3) |
2.59 |
2.64 |
2.65 |
2.73 |
|
|
Q3 (m·s-3) |
2.72 |
2.80 |
3.11 |
3.08 |
|
|
EV: ellipsoid volume; PV: polyhedron volume; AV: average velocity; D: dominant arm; N: non-dominant arm; EO: Eyes Open; EC: Eyes Closed; Min: Minimum; Max: Maximum; Mdn: Median; Q1: First Quartile; Q3: Third Quartile. |
|||||
Table 2: Comparison of the ellipsoid volumes, poly-hedron volumes and average velocities of dominant and non-dominant arms.
|
|
|
|
EO D |
EO N |
EC D |
EC N |
|
EV |
Min (m3·s-6) |
2.00·10-4 |
3.00·10-4 |
2.00·10-4 |
5.00·10-4 |
|
|
Max (m3·s-6) |
9.00·10-4 |
1.10·10-3 |
1.50·10-3 |
1.60·10-3 |
||
|
Mdn (m3·s-6) |
5.00·10-4 |
7.00·10-4 |
7.00·10-4 |
7.00·10-4 |
||
|
Q1 (m3·s-6) |
3.00·10-4 |
5.00·10-4 |
4.00·10-4 |
6.00·10-4 |
||
|
Q3 (m3·s-6) |
8.00·10-4 |
9.00·10-4 |
1.00·10-3 |
1.30·10-3 |
||
|
PV |
Min (m3·s-6) |
4.00·10-3 |
5.00·10-3 |
4.00·10-3 |
9.00·10-3 |
|
|
Max (m3·s-6) |
1.80·10-2 |
2.00·10-2 |
3.00·10-2 |
3.10·10-2 |
||
|
Mdn (m3·s-6) |
8.00·10-3 |
1.20·10-2 |
1.50·10-2 |
1.90·10-2 |
||
|
Q1 (m3·s-6) |
6.00·10-3 |
1.00·10-2 |
8.00·10-3 |
1.10·10-2 |
||
|
Q3 (m3·s-6) |
1.30·10-2 |
1.70·10-2 |
2.20·10-2 |
2.80·10-2 |
||
|
AV |
Min (m·s-3) |
2.40 |
2.47 |
2.54 |
2.80 |
|
|
Max (m·s-3) |
3.58 |
3.57 |
4.56 |
4.33 |
||
|
Mdn (m·s-3) |
2.80 |
3.25 |
2.96 |
3.16 |
||
|
Q1 (m·s-3) |
2.49 |
2.97 |
2.62 |
2.98 |
||
|
Q3 (m·s-3) |
3.15 |
3.49 |
3.43 |
3.79 |
||
|
EV: ellipsoid volume; PV: polyhedron volume; AV: average velocity; D: dominant arm; N: non-dominant arm; EO: Eyes Open; EC: Eyes Closed; Min: Minimum; Max: Maximum; Mdn: Median; Q1: First Quartile; Q3: Third Quartile. |
||||||
Comparison of the dominant and non-dominant arms during a quiet stance trial
Detailed comparison of EV data regarding the dominant and non-dominant arm did not identify significant differences between dominant and non-dominant arm, see Tab. 3. Significant differences were recorded when the EV values were compared on the same arm segment while the subjects were measured with EO and EC, see Tab. 3. Likewise, the PV values on the dominant and non-dominant arms differed when the data was measured on the upper arms, but no notable differences were observed when the data was measured on the forearms of subjects with EO or EC, see Tab. 3. In contrast however, the comparison of PVs on the same arm segment measured during standing with EO and EC found significant differences when measured for specific arm segments, see Tab. 3. The difference in EV values was noticeable also between the data measured on forearm and upper arm of subjects with EO or EC, see Tab. 3, regardless whether taken on the dominant or non-dominant arm. Finally, the AV data obtained from the same arm segment measured while standing with EO and EC showed a significant difference when specific arm segment was measured, see Tab. 3.
Table 3: The calculated p-values as obtained by the Wilcoxon test to assess the differences between the measured results of D and N arms, and measurements with EO and EC.
|
|
|
Forearm |
Upper arm |
|
EV |
EO D vs. EO N |
0.84 |
0.06 |
|
EC D vs. EC N |
0.69 |
0.07 |
|
|
EO D vs. EC D |
0.09 |
0.04* |
|
|
EO N vs. EC N |
0.04* |
0.02* |
|
|
PV |
EO D vs. EO N |
0.20 |
0.04* |
|
EC D vs. EC N |
0.23 |
0.02* |
|
|
EO D vs. EC D |
0.03* |
0.02* |
|
|
EO N vs. EC N |
0.13 |
0.03* |
|
|
AV |
EO D vs. EO N |
0.04* |
0.04* |
|
EC D vs. EC N |
0.02* |
0.11 |
|
|
EO D vs. EC D |
0.01* |
0.03* |
|
|
EO N vs. EC N |
0.03* |
0.03* |
|
|
EV: ellipsoid volume; PV: polyhedron volume; AV: average velocity; D: dominant arm; N: non-dominant arm; EO: Eyes Open; EC: Eyes Closed; * - significant difference. |
|||
Correlation between the data using three different methods
The comparison of EV, PV and AV values measured on the dominant and non-dominant arm, and using
the Spearman's rank correlation coefficient indicates a strong or very correlation, i.e. strong positive relation-ship between the movements of the dominant and non-dominant arm, see Tab. 4. In all the compared data groups, the correlations were large.
Table 4: Spearman's rank correlation coefficient showing the relationship between the data measured on the dominant and non-dominant arms.
|
|
|
EO D |
EO N |
EC D |
EC N |
|
Forearm |
EV vs. PV |
0.98** |
0.86** |
0.97** |
0.71* |
|
PV vs. AV |
0.82** |
0.76* |
0.83** |
0.81** |
|
|
AV vs. EV |
0.76* |
0.74* |
0.84** |
0.71* |
|
|
Upper arm |
EV vs. PV |
0.96** |
0.94** |
1.00** |
0.81** |
|
PV vs. AV |
0.89** |
0.97** |
0.98** |
0.68* |
|
|
AV vs. EV |
0.94** |
0.95** |
0.98** |
0.80** |
|
|
EV: ellipsoid volume; PV: polyhedron volume; AV: average velocity; D: dominant arm; N: non-dominant arm; EO: Eyes Open; EC: Eyes Closed; * - strong correlation; ** - very strong correlation. |
|||||
Discussion
This study has verified the novel methods based on vertical, medio-lateral and anterior-posterior accelera-tions plotted against each other. The calculated EVs, PVs and AVs proved the applicability of the quantitative indicators and detected differences in the upper limbs' behavior during quiet standing. The key medical findings of this study revealed significant differences of PV and AV between the D and N upper extremity, as well those of EV, PV and AV when the data was measured with EO and EC, see Tab. 2. The higher values of indicators were observed for N extremity when measured with EC. Statistically significant differences between the D and N arm movements were recognised only in PV and AV. It is because the PV method is more sensitive to the evaluation of random deviations, i.e. the range of measured data; as the polyhedron bounds all measured data, compared to the EV method, where the ellipse limits only 95% of the measured data [7]. In the case of AV, the method's high sensitivity to a motion corresponds with arm tremors. It is because the AV calculation relates not only to a range of measured data but also to the intensity of data changes occurring in the segment measured during the specific time interval [35]. Looking at the differences between the forearm and upper arm results, the AV-based method identified significant differences between the D and N arm. The PV-based method also identified considerable differ-ences between the D and N arm however, only in the upper arm. The differences between the measured results utilising the two methods can be ascribed to the fact that the polyhedron method is more sensitive to the range of measured data, and the AV method is more sensitive to the intensity of data changes. The differ-ences in the data measured on D and N arms therefore mainly relates to the intensity of movements, i.e. trem-bling of arms.
Spontaneous movements of the extremity in a resting position or during a postural activity, are called physiologic tremors (PT). There are two sources of PT – oscillations driven by mechanical properties of the limb in the corresponding resonance frequency and the central oscillatory components synchronising motor units' activity of muscles responsible for the segment's movements [38]. Several studies have documented, that the PT in the upper extremity is mostly driven by limb mechanics with minimal central influence [38–40]. In line with this finding, Carignan et co-workers discovered that tremors of all segments are driven by the angular displacement in the shoulder joint [41]. Side differences in the tremor intensity are not age, gender or laterality dependent, but are dictated by the segment's weight and dimensions [39]. Laterality effects, observed in the subjects under observation, can be explained by different arm weight of a D and N extremity. These side
differences between arm weight can account for up to 4.8% [42]. Side differences in the grip and elbow strength, which are influenced by different muscle mass, were recognised by Aoki et al. [43]. It can, therefore, be assumed that the less heavy a non-dominant extremity is, the more intensive is the tremble. The literature cites only a few references concerning the correlation of tremor with hand laterality. For example, Machowska-Majchrzak discovered that the essential tremor was more intense in the N extremity in 62% of patients [44, 45]. In contrast, no correlation of arm swing in walking was identified with laterality, possibly due to an important central component in this involuntary movement [46].
The statistical relevance of the difference between the tremor intensity measured with EO and EC is difficult to explain, and moreover, citations around this discrepancy can be found in current literature. This phenomenon maybe explained by the fact that more effort to attain proper posture in space is required without visual input. For this reason, muscle activity increases and central oscillations are added to the pure mechanical oscillations in an undisturbed stance. This hypothesis could be easily tested in the future by EMG recording of the trembling segments. However, in respect to the methods proposed and discussed by the authors, the difference was recognised as important. The results between the types of stance tasks differed and have been taken into consideration as important elements. Hence, it can be concluded that performance of complex stance tasks when the visual input is reduced, highlights the differences in arm movements during a quiet stance.
The results show that the AV-based method is the most sensitive and its results are similar to the findings of previous studies. The PV-based method also proved to be sensitive; moreover, it distinguishes between D and N arm movements. The EV-based method can identify differences in the type of stance task (i.e. differences between performing with EO and EC). In all measurement methods, a strong or very strong correlation was found between EV, PV and AV. The proposed methods lead to similar conclusions but differ in sensitivity and therefore future medical application.
The main limitation of this study is its small scale and represented a number of subjects involved in measure-ments. However, to test the fundamental attributes of the quantitative methods proposed for the study of postural stability in this preliminary study, the sample size of ten subjects seems sufficient as it is comparable with similar works focused on the postural stability evaluation [47].
Conclusions
This article presented and tested new methods for the quantitative assessment of postural stability during static upright stance for the evaluation of the upper arm and forearm movement. The evaluation data used by these methods were obtained from IMUs which are affordable to acquire. In some cases, the results demonstrated significant differences between the movements of the D and N arm, as well as those between the movement of the arm while standing with EO and EC. The given results demonstrate a potential of the methods proposed to examine the postural stability of the appendicular skeleton segment during quiet stance. The proposed application of the methods described has not been used before and therefore can become a new tool for identifying the degree of disease or evaluating the rehabilitation process for treating the appendicular skeleton. The proposed methods and results can also be seen as postural stability indicators in healthy subjects, relating to the ability to display movements corre-sponding to subjects with impaired movements. The proposed methods can also potentially become part of systems using cheaper IMUs in mobile phones or watches, which can significantly influence and comple-ment the current ways of measuring the segments' movement of the appendicular skeleton within telemedi-cine. The proposed methods and medical findings
can contribute to potentially more extensive IMU application in medical practice.
Acknowledgement
The work was done in the Research Group of Biomechanics and Assistive Technology and with the support of the Faculty of Biomedical Engineering of the Czech Technical University in Prague. This project was supported by project SGS18/201/OHK4/3T/17 of the CTU in Prague.
Sources
- Duclos C, Nadeau S, Lecours J. Lateral trunk displacement and stability during sit-to-stand transfer in relation to foot placement in patients with hemiparesis. Neurorehabilitation and Neural Repair. 2008 Nov;22(6):715–22.
- Khasnis A, Gokula RM. Romberg's test. Journal of postgraduate medicine. 2003 Apr 1;49(2):169.
- Morris ME. Movement disorders in people with Parkinson disease: a model for physical therapy. Physical therapy. 2000 Jun 1;80(6):578–97.
- Mancini M, Salarian A, Carlson-Kuhta P, Zampieri C, King L, Chiari L, Horak FB. ISway: a sensitive, valid and reliable measure of postural control. Journal of neuroengineering and rehabilitation. 2012 Dec;9(1):59.
- Liu J, Zhang X, Lockhart TE. Fall risk assessments based on postural and dynamic stability using inertial measurement unit. Safety and health at work. 2012 Sep 1;3(3):192–8.
- Van de Warrenburg BP, Bakker M, Kremer BP, Bloem BR, Allum JH. Trunk sway in patients with spinocerebellar ataxia. Movement disorders: official journal of the Movement Disorder Society. 2005 Aug;20(8):1006–13.
- Kutilek P, Cakrt O, Socha V, Hana K. Volume of confidence ellipsoid: a technique for quantifying trunk sway during stance. Biomedical Engineering/Biomedizinische Technik. 2015 Apr 1; 60(2):171–6.
- Raymakers JA, Samson MM, Verhaar HJ. The assessment of body sway and the choice of the stability parameter (s). Gait & posture. 2005 Jan 1;21(1):48–58.
- Manto MU, editor. Cerebellar disorders: a practical approach to diagnosis and management. Cambridge University Press; 2010 Mar 25.
- Oldfield RC. The assessment and analysis of handedness: the Edinburgh inventory. Neuropsychologia. 1971 Mar 1;9(1):97–113.
- Pérez R, Costa Ú, Torrent M, Solana J, Opisso E, Cáceres C, Tormos JM, Medina J, Gómez EJ. Upper limb portable motion analysis system based on inertial technology for neurorehabili-tation purposes. Sensors. 2010;10(12):10733–51.
- Stirling D, Hesami A, Ritz C, Adistambha K, Naghdy F, Serra PA. Symbolic modelling of dynamic human motions. InBiosensors 2010 Feb 1 (pp. 282–302). InTech.
- Aw ST, Halmagyi GM, Black RA, Curthoys IS, Yavor RA, Todd MJ. Head impulses reveal loss of individual semicircular canal function. Journal of Vestibular Research. 1999 Jan 1;9(3):173–80.
- Allum JH, Nijhuis LB, Carpenter MG. Differences in coding provided by proprioceptive and vestibular sensory signals may contribute to lateral instability in vestibular loss subjects. Experimental brain research. 2008 Jan 1;184(3):391–410.
- Findling O, Sellner J, Meier N, Allum JH, Vibert D, Lienert C, Mattle HP. Trunk sway in mildly disabled multiple sclerosis patients with and without balance impairment. Experimental brain research. 2011 Sep 1;213(4):363.
- Kennie TJ, Petrie G. Engineering surveying technology. CRC Press; 2014 Apr 21.
- Osler CJ, Reynolds RF. Postural reorientation does not cause
the locomotor after-effect following rotary locomotion. Experimental brain research. 2012 Aug 1;220(3-4):231–7. - Altun K, Barshan B. Pedestrian dead reckoning employing simultaneous activity recognition cues. Measurement Science and Technology. 2012 Jan 11;23(2):025103.
- Gil-Agudo Á, de Los Reyes-Guzman A, Dimbwadyo-Terrer I, Peñasco-Martín B, Bernal-Sahún A, López-Monteagudo P, del Ama-Espinosa A, Pons JL. A novel motion tracking system for evaluation of functional rehabilitation of the upper limbs. Neural regeneration research. 2013 Jul 5;8(19):1773.
- Honegger F, Van Spijker GJ, Allum JH. Coordination of the head with respect to the trunk and pelvis in the roll and pitch planes during quiet stance. Neuroscience. 2012 Jun 28;213 : 62–71.
- Zadnikar M, Rugelj D. Postural stability after hippotherapy in an adolescent with cerebral palsy. Journal of Novel Physiotherapies. 2011;1(1).
- Stovall, Sherryl H. Basic Inertial Navigation. China Lake, CA: Naval Air Warfare Center Weapons Division, 1997.
- Farrell J, Barth M. The global positioning system and inertial navigation. New York, NY, USA: Mcgraw-hill; 1999 Jan 21.
- Oliveira LF, Simpson DM, Nadal J. Calculation of area of stabilometric signals using principal component analysis. Physiological measurement. 1996 Nov;17(4):305.
- Jolliffe IT. Principal component analysis. Springer-Verlag, New York, 2002.
- Rocchi MB, Sisti D, Ditroilo M, Calavalle A, Panebianco R. The misuse of the confidence ellipse in evaluating statokinesigram. Ital J Sport Sci. 2005 Dec;12(2):169–72.
- Van Kreveld M, Schwarzkopf O, de Berg M, Overmars M. Computational geometry algorithms and applications. Springer; 2000.
- Chazelle B. An optimal convex hull algorithm in any fixed dimension. Discrete & Computational Geometry. 1993 Dec 1;10(4):377–409.
- Knuth DE. Axioms and hulls. Berlin: Springer-Verlag; 1992 Jul.
- Durst LK. Committee on the Undergraduate Program in Mathematics Geometry Conference, Part I: Convexity and Applications.
- Ogilvy CS. Excursions in geometry. Courier Corporation; 1990.
- Goldman RN. Area of planar polygons and volume of polyhedra. InGraphics gems II 1991 Jan 1 (pp. 170–171). Morgan Kaufmann.
- Teranishi T, Kondo I, Sonoda S, Wada Y, Miyasaka H, Tanino G, Narita W, Sakurai H, Okada M, Saitoh E. Validity study of the standing test for imbalance and disequilibrium (SIDE): Is the amount of body sway in adopted postures consistent with item order?. Gait & posture. 2011 Jul 1;34(3):295–9.
- Stins JF, Ledebt A, Emck C, Van Dokkum EH, Beek PJ. Patterns of postural sway in high anxious children. Behavioral and Brain Functions. 2009 Dec;5(1):42.
- Hejda J, Cakrt O, Socha V, Schlenker J, Kutilek P. 3-D trajectory of body sway angles: A technique for quantifying postural stability. Biocybernetics and Biomedical Engineering. 2015 Jan 1;35(3):185–91.
- Fritz CO, Morris PE, Richler JJ. Effect size estimates: current use, calculations, and interpretation. Journal of experimental psychology: General. 2012 Feb;141(1):2.
- Coolican, H. (2009). Research methods and statistics in psychology. London: Hodder & Stoughton Publisher.
- Elble RJ. Characteristics of physiologic tremor in young and elderly adults. Clinical neurophysiology. 2003 Apr 1;114(4): 624–35.
- Raethjen J, Pawlas F, Lindemann M, Wenzelburger R, Deuschl G. Determinants of physiologic tremor in a large normal population. Clinical Neurophysiology. 2000 Oct 1;111(10): 1825–37.
- Raethjen J, Lauk M, Köster B, Fietzek U, Friege L, Timmer J, Lücking CH, Deuschl G. Tremor analysis in two normal cohorts. Clinical Neurophysiology. 2004 Sep 1;115(9):2151–6.
- Carignan B, Daneault JF, Duval C. The organization of upper limb physiological tremor. European journal of applied physiology. 2012 Apr 1;112(4):1269–84.
- Clauser CE, McConville JT, Young JW. Weight, volume, and center of mass of segments of the human body. Antioch Coll Yellow Springs OH; 1969 Aug.
- Aoki H, Demura S. Characteristics and lateral dominance of hand grip and elbow flexion powers in young male adults. Journal of physiological anthropology. 2008 Jul 31;27(4):201–6.
- Machowska-Majchrzak A, Pierzchała K, Pietraszek S, Łabuz-Roszak B. Essential tremor–assessment of tremor accelerometric parameters' symmetry and the relationship between hand dominance and severity of tremor. Neurologia i neurochirurgia polska. 2011 Jan 1;45(2):121–7.
- Machowska-Majchrzak A, Pierzchała K, Pietraszek S, Łabuz-Roszak B, Bartman W. The usefulness of accelerometric registration with assessment of tremor parameters and their symmetry in differential diagnosis of parkinsonian, essential and cerebellar tremor. Neurologia i neurochirurgia polska. 2012 Jan 1;46(2):145–56.
- Kuhtz-Buschbeck JP, Brockmann K, Gilster R, Koch A, Stolze H. Asymmetry of arm-swing not related to handedness. Gait & posture. 2008 Apr 1;27(3):447–54.
- Diener HC, Dichgans J, Guschlbauer B, Bacher M, Rapp H, Klockgether T. The coordination of posture and voluntary movement in patients with cerebellar dysfunction. Movement disorders: official journal of the Movement Disorder Society. 1992;7(1):14–22.
Labels
BiomedicineArticle was published in
The Clinician and Technology Journal

2019 Issue 2
Most read in this issue
- Methods evaluating upper arm and forearm movement during a quiet stance
- Effect of the zinc phthalocyanine mediated photodynamic therapy on cytoskeletal apparatus of hela cells
- Wrist rehabilitation with manipulator to perform passive and active exercises
- A framework to assess mechanics of stump–socket interaction in transfemoral amputees