-
Medical journals
- Career
Translating Basic Science to Clinical Care
Authors: W. Severinghaus John
Authors‘ workplace: Professor of Anesthesiology Emeritus, University of California San Francisco, USA
Published in: Anest. intenziv. Med., 21, 2010, č. 2, s. 70-76
Category: Anaesthesiology - Special Article
Preface
Translational science is a new word coined to label the ancient practice of transferring to clinical care some discovery from laboratory basic science helpful to the sick. The most publicly evident result of anesthesiology research has been a remarkable improvement in the safety of anesthesia. Basic science education, training, and research were largely responsible for transforming anesthesia from a surgical service into its central roles in academic medicine and healthcare. The current atrophy of academic medical funding threatens the remarkable productivity of anesthesia research. The author here traces his role in translating lab science to improve patient safety in the practice of anesthesiology. While serving under the WWII doctor draft at the National Institutes of Health (NIH), he needed analysis of arterial blood partial pressure of arterial pH, oxygen (PO2) and carbon dioxide (PCO2) in dogs during investigations of respiratory dead space and lung gas exchange. The instruments he devised for research laboratory analyses, became universally available clinical tools in healthcare. The author sought other physiological problems that required blood gas analysis in anesthesia and cardiorespiratory physiology, particularly at high altitude. This eventually led him, over much of his professional life, to develop other physical devices for healthcare.
From Physics to Monitors for Medicine
During World War II, I was educated as a physicist with an emphasis on electronics, and employed at the Massachusetts Institute of Technology (MIT) Radiation Laboratory, in Cambridge, developing radar equipment. On August 6, 1945, aghast at the bombing of Hiroshima, I resigned from MIT to change my career from physics to medicine, hoping to apply electronics to health care.
While in medical school in the fall of 1947, I saw a demonstration that breathing could be driven by electrical stimulation of one phrenic nerve with a skin surface electrode. I decided to build an easily portable electrophrenic respirator. The physiology department provided space and tools. I published that device [1] and constructed 6 for clinical trials in various anesthesia departments. Virginia Apgar at Columbia University invited me to try it on dying premature infants. The diaphragm moved, but air did not. Electrophrenic respiration proved to be essentially useless. Positive pressure devices were soon introduced.
After internship, I expected to be a postdoctoral research fellow in biophysics. I visited Robert Dripps, head of anesthesia at the University of Pennsylvania, because he had bought one of my useless electrophrenic respirators. Within 5 minutes he persuaded me that anesthesia would be the best field in which I could apply electronics to medicine. In 1952, the only routinely used monitor in anesthesia was a blood pressure cuff. Electrical apparatus was dangerous in operating rooms with cyclopropane and ether.
Measuring the Uptake of Nitrous Oxide During Anesthesia
A few weeks after beginning residency with Dripps, I decided to measure the rate of absorption of N2O into the body during routine anesthesia. Most ear, nose, throat procedures were done without an endotracheal tube under nitrous oxide and ether. With enough morphine and 80% N2O, I found that I could tape the patient’s mouth shut, plug up the other nostril, and connect a nasal airway to the anesthesia circuit, and pre-oxygenate the patient for 5 minutes. I then connected the patient’s airway to a 5-liter spirometer pre-filled with N2O, a closed circuit with CO2 absorber. I squeezed the sampling bulb of a Pauling paramagnetic oxygen analyzer and adjusted both the O2 and N2O flow meters to set and keep oxygen at 20% and spirometer volume constant. I manually recorded flow rates and dry-test gas meter volumes periodically while also caring for the anesthetized patient. (No permission was needed to do patient research until decades later). I found that uptake declined with the square root of time, starting with nearly 1 liter per minute. I was invited to present that study to the American Society of Clinical Investigation (ASCI) [2].
Post-Doctoral Training with Julius Comroe
Dr. Dripps assigned me to a research year studying respiratory physiology with physiologist-pharmacologist Julius Comroe, also at the University of Pennsylvania. I coauthored several papers from that year, not related to anesthesia, but I must have deeply impressed Dr. Comroe, who, years later, persuaded me to come with him to his new Cardio Vascular Research Institute (CVRI) at University of California in San Francisco. To get my agreement he also persuaded the UCSF chairman of surgery to let anesthesia become an independent department, and, at my suggestion, persuaded UCSF to invite Stuart Cullen to be its first chair. Within a few years, the UCSF Department of Anesthesia became among the best regarded and funded in the world.
National Institutes of Health
To satisfy the doctor draft, in 1953 I joined the US Public Health Service at the new NIH Clinical Center Hospital in Bethesda, MD, as a research anesthesiologist. For cardiac and brain surgery at the NIH, we used moderately deep hypothermia (30 °C) to permit brief interruption of circulation. No electrical monitoring was permitted because we used flammable anesthetics. I used my electronics training and experience at MIT, and the newly invented transistors, to devise a monitor.
Monitoring, the Telecor
I designed and built a transistorized monitor that displayed body temperature, beeped with each cardiac R wave, and provided heart and lung sounds, all 3 signals picked up from a modified esophageal catheter [3]. I arranged for a company to market it. They liked the name I gave it, Telecor, but abandoned my design and built a finger-tip pulse monitor that chirped. It was useless, and was soon withdrawn from the market. I could not patent it, being a government employee, so I had no control over the company’s decisions.
Pulmonary Blood Gas Studies
Soon after beginning at the NIH, I read a paper claiming that hypothermia blocked pulmonary CO2 excretion. I doubted it and decided to carefully compare end-tidal and arterial PCO2 in hypothermic dogs. In 1953, arterial PCO2 had to be calculated from pH, measured at room temperature and ‘corrected’ to 37 °C by a factor with limited accuracy, plasma CO2 content requiring extraction in the Van Slyke manometric apparatus, and then calculation of PCO2 using the Henderson-Hasselbalch equation. It was a timeconsuming and tedious process. We built a thermostated pH meter, obtained standard buffers from the National Bureau of Standards, and improved the separation of plasma to avoid loss of CO2. Those studies disproved that claim of a hypothermic block in the lung, and in the process improved the accuracy of measurement of pH and PCO2, publishing a series of papers on methods [4, 5], but we could still only analyze 10 samples a day. Thanks to several inventions, this method is no longer used.
The Inventions of Blood Gas Electrode Analysis
Stow’s PCO2 Electrode
In 1954, at an American Physiology Fall meeting, I heard Richard Stow, from the Department of Physical Medicine at Ohio State University Medical School, describe his invention of a PCO2 electrode [6]. Stow was involved in the care of polio patients, in iron lungs, at Ohio State. They needed arterial PCO2 analyses to control the ventilation. He read about single ion electrodes, and conceived of a CO2 electrode. He wrapped a latex membrane over a combined pH and reference electrode, wet with distilled water (Figure 1). It responded to changes of CO2 tension. He offered to sell the idea to Beckman Co in a letter in late 1953, but they were not interested. He said that the electrode had a serious incurable drift and could not be made useful. In response to my suggestion to add sodium bicarbonate to the film of water on the pH electrode surface, he said bicarbonate would buffer the H+ so there would be no signal. I disagreed. We agreed that I would try adding soda.
1. Richard Stow, Ph.D. (1916–1995), Department of Physical Medicine, Ohio State University School of Medicine, Columbus, Ohio On the right is his scheme of an electrode to measure blood PCO2, badly needed to regulate the iron lungs ventilating patients with polio in the early 1950s. 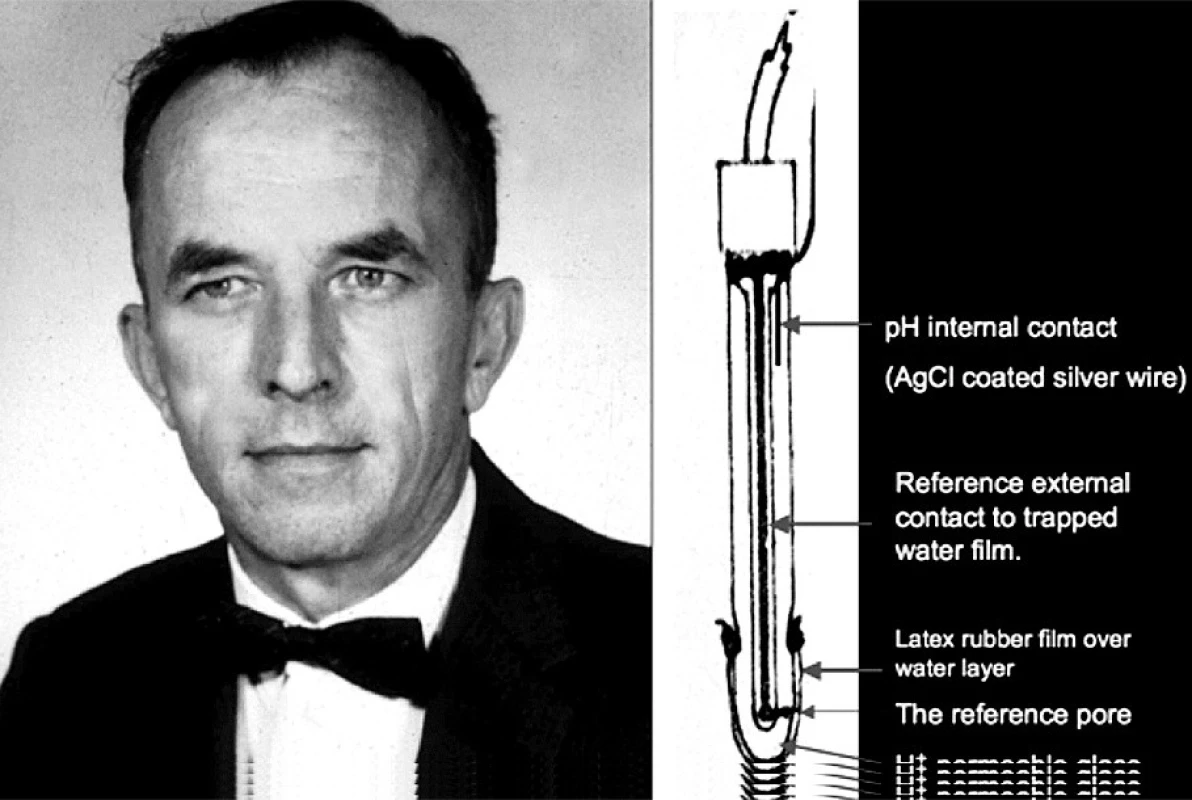
A few days later, I assembled a Stow-type CO2 electrode with 25 mM sodium bicarbonate and 0.1 M NaCl in the liquid film between a latex film and the pH sensitive glass. It worked well and was stable. I notified Stow that I would build a working electrode to study. He dropped the project and 3 years later published a short note on the invention and its problems before the bicarbonate idea [7].
I found that with soda, a 10-fold rise of PCO2 increased hydrogen ion activity 10-fold (a pH fall of 1 unit), twice as much as with distilled water, and stopped the drift that had frustrated Stow. My lab technician and I proceeded to design and optimize a working blood PCO2 electrode for our lab work with animals. Within weeks we were able to abandon the Van Slyke and Henderson Hasselbalch equation method of computing PCO2. I regret that I made no effort to use it clinically until 1958.
Clark’s Oxygen Electrode
Before 1956, to directly measure blood PO2, physiologists used Richard Riley’s bubble method although it was slow, inaccurate, and useless over 95% saturation.
In 1948, Leland Clark, a liver enzyme research chemist at Antioch College, OH, had built a successful bubble type blood oxygenator to perfuse livers. His paper was rejected by the editor of Science until he could provide measurements of the rise in PO2 in the oxygenator. In order to measure PO2, he turned to polarography, a method discovered by Jaroslav Heyrovsky in Prague in the 1920s resulting in a Nobel prize [8]. Heyrovsky had shown that bare platinum polarographic cathodes are promptly poisoned when used to measure blood PO2, so the method was not used.
To prevent poisoning, Clark covered a polarographic cathode with cellophane. It worked, but the signal was extremely sensitive to blood flow. To reduce the flow sensitivity, he changed to a much less oxygen-permeable polyethylene membrane [9]. His reference electrode was in contact with the blood. Polyethylene is an insulator so it should not have worked. However, he later realized that it worked because of electrical leakage under the edges of the polyethylene membrane held in place with a rubber O-ring.
On October 4, 1954, Clark suddenly experienced an “AHA!” moment, realizing that he could make an electrically insulated polarographic sensor with cathode and reference electrode combined under the membrane, permitting it to work in either air or liquid. He constructed and successfully tested one the same day. He and his lawyer applied for a patent, and agreed in 1955 to sell the patent to Beckman Co. He designed the electrode and arranged to have it temporarily manufactured by Yellow Springs Instrument Company in Antioch, OH, but refrained from publication.
In early 1956, I invited a group of about 30 respiratory physiologists who had been trying to measure PO2to join in a small seminar at the Federation of American Societies for experimental Biology (FASEB) annual April physiology meetings in Atlantic City, NJ. At that meeting, Leland Clark revealed publicly and demonstrated his invention (Figure 2). Clark’s stunning disclosure triggered the blood gas revolution and launched a billion dollar business.
2. Leland C. Clark, Ph.D. (1918–2005), a steroid biochemist at Fels Research Institute, Antioch College, Yellow, Springs Ohio 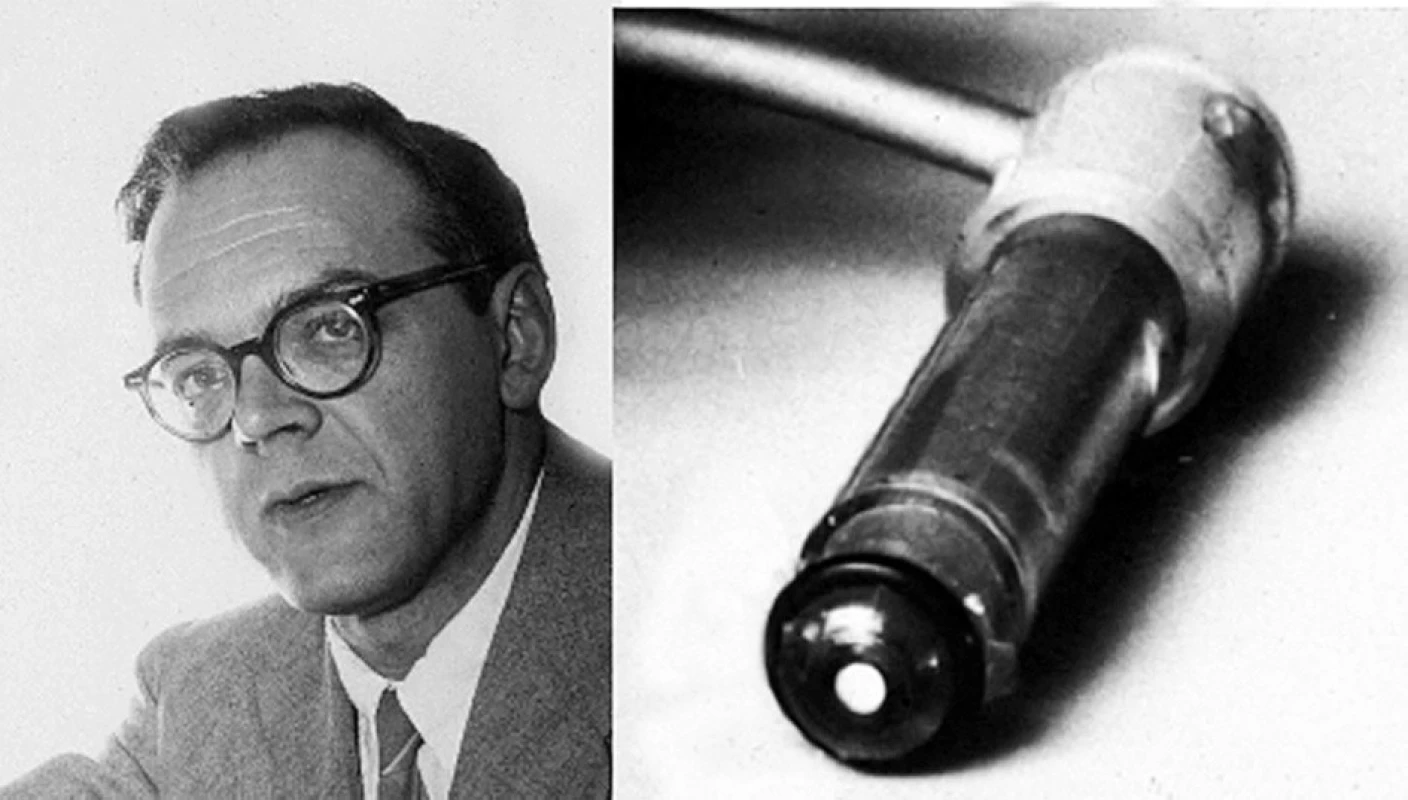
His polarographic membrane covered oxygen electrode (right) was manufactured by the Yellow Springs Inst, Co., and disclosed publicly by Clark on April 18, 1956 at a meeting of interested physiologists at the annual meeting of biologists in Atlantic City, N. J. Beckman’s lawyers rewrote Clark’s patent application, claiming it covered all membrane-based electrochemical sensors. Sixteen years later, after much litigation in which Beckman sued a competitor, the court declared Beckman’s patent fraudulent because the lawyers knew that Stow’s letter to Beckman reporting a CO2 electrode invention preceded Clark’s patent. Beckman never paid Clark. Now, after 50 years, every blood gas analyzer in the world contains a Clark-type polarographic oxygen and a Stow-Severinghaus CO2 electrode.
Development of Blood Gas Analyzers
With Clark’s approval, I decided to combine his electrode and the CO2 electrode in a blood gas analyzer [10]. Because of its large platinum cathode, in unstirred blood Clark’s electrode signal drifted slowly down to less than half the actual PO2. I built a cuvette with a tiny stirring paddle, but blood still read 10% to 15% too low compared with gas calibration. I concluded that it had to be calibrated with blood of a known PO2, so I added a tiny tonometer to the thermostat. My design was constructed by the physiology department machine shop in Iowa City while I completed a second year of residency with Stuart Cullen. This first blood PO2 and PCO2 analyzer was exhibited at the fall ASA meeting in 1957 (Figure 3). In 1958, Beckman redesigned Clark’s electrode, reducing the cathode diameter to 10 microns. This tiny cathode reduced so little oxygen that the stirring paddle and tonometer were no longer needed.
3. This first blood gas analyzer containing oxygen and carbon dioxide electrodes was displayed at the American Society of Anesthesiologists in October, 1957 and again at the American Physiologic Society in April, 1958 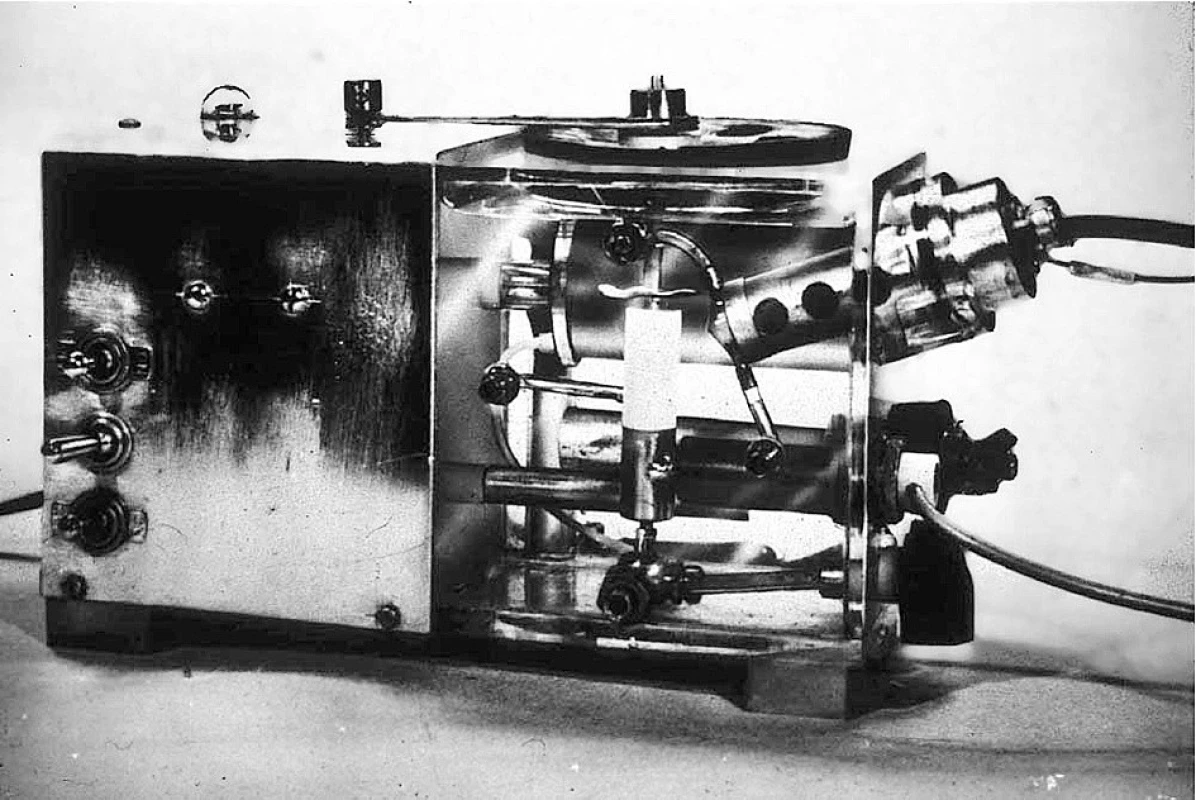
A pH electrode was added in late 1958, making the first 3-function blood gas analyzer. That instrument is now in the Smithsonian Museum exhibit, “The Conquest of Pain”. This device clearly needed a pH electrode to complete the idea of a blood gas analyzer. After trying to incorporate a commercial pH electrode with a home made reference electrode, I designed and patented (with the University of California) a combined, self-contained pH and reference electrode. This open liquid junction method is used in most blood gas systems.
Respiratory Physiologic Studies
The Discovery of the Central CO2 Chemoreceptors
In the early 1960s, Robert Mitchell, my lab colleague in the CVRI at UCSF from 1958 to 1990, and Hans Loeschcke (visiting us from Göttingen) discovered the brain’s CO2 sensor on the ventro-lateral surface of the medulla of cats [11]. These sensory cells responded to their ECF pH, which is controlled by blood PCO2 and cerebrospinal fluid (CSF) bicarbonate. They do not respond to arterial blood acidosis. We thought that CSF acid base regulation might differ from blood, which would explain some still mysterious effects seen during acclimatization to high altitude and after descent.
Acclimatization to High Altitude
The interest of anesthesiologists in high altitude research derives from a need to safely study hypoxia, the most common cause of injury and death during and following anesthesia.
In the 1950s the University of California had built several high altitude facilities for research ranging from astronomy and general biology of plants, trees and animals to human acclimatization studies. These laboratories were located in a mountain range east of the Sierra near the bristlecone pines, the world’s oldest living things. In July 1962, four of us set up a study at the Pace-Barcroft laboratory in the White Mountains at 3810 m altitude. We volunteered to tap each other’s lumbar CSF, measuring pH and bicarbonate, first at sea level and then daily during a 4-day stay at the high-altitude lab. Blood and CSF pH and PCO2 analysis were done with my portable homemade blood-gas apparatus.
The discovery of this first altitude trip was that CSF bicarbonate falls within hours at altitude while blood bicarbonate and base excess fall slowly over the first week [12]. We initially (and mistakenly) inferred that CSF pH must be regulated by active transport. That remains unproven because hypoxic lactic acid and brain tissue strong ion buffering are probable causes. We assumed, also incorrectly, that pH would be restored to its normal value with time. It is not, because the strong carotid body hypoxic drive at altitude is partly offset by continued CSF alkalosis.
Cerebral Blood Flow at High Altitude
Tom Hornbein joined us in 1964 as one of seven subjects and as investigator for a study of cerebral blood flow at altitude. We sampled jugular venous blood while subjects breathed 15% N2O to measure CBF. CBF was increased about 25% on the initial altitude test, but fell nearly to normal by the 3rd to 5th day [13].
Blunting of Hypoxic Chemosensitivity in Natives at High Altitude
In 1964 in the Peruvian Andes at Cerro de Pasco, 4389 m altitude, Cedric Bainton and I studied high altitude native respiratory responses to CO2 and hypoxia [14]. We found that in normal adult natives, carotid chemosensitivity to isocapnic hypoxia was only 26% of sea level normal. In natives with a hematocrit higher than 70%, the level defined as chronic mountain sickness, hypoxic ventilatory response was only 11% of normal. We later showed that this blunting was nearly irreversible even in young people born at altitude but living for years at sea level [15]. Others later showed that the blunting in adults was gradual over 5 to 20 years at 3100 m altitude.
Danish Collaborations
The altitude studies suggesting active transport across the blood brain barrier led me to spend two years in Copenhagen, Denmark, with Hans H. Ussing, a worldrenowned membrane transport expert to test my hypothesis of active transport regulation of CSF pH. My studies failed to either confirm or reject the hypothesis, and it remains unsettled. However, my years in Copenhagen proved highly productive and interesting. I participated in teaching anesthesia-related physiology to third world anesthesia students in the World Health Organization program in Copenhagen, and collaborated with many scientists on several different projects.
How PCO2 Controls Cerebral Blood Flow
In Copenhagen, Niels Lassen and I devised a simple experiment on ourselves and other volunteers to prove that cerebral blood flow is regulated by the pH of the cerebral arteriolar ECF, not the pH or PCO2 of the brain tissue [16]. We showed that the response time constant of CBF to a step fall of PCO2 produced by voluntary extreme hyperventilation was about 25 seconds, long enough to raise arteriolar wall smooth muscle cellular pH, whereas the brain tissue washout time constant for CO2 (and thus ECF pH) is known to be 2–4 minutes. An incidental effect of my being a subject in our experiment was a unilateral paralysis of my tongue lasting 3 days after unsuccessful repeated attempt by Lassen to sample blood from my right internal jugular vein.
In 1972, several Danish scientists and I studied brain blood flow and metabolism of natives of La Paz, Bolivia, at 3800 to 4300 m altitude. It was remarkably normal while breathing the high altitude air, but it fell substantially when subjects breathed oxygen. That doesn’t happen at sea level, and shows that the altitude natives have some continuous hypoxic cerebral vasodilation.
Blood Gas and Acid-Base Chemistry Studies
I collaborated with clinical chemists Poul Astrup and Ole Siggaard Andersen in acid-base analysis, and with F. J. W. Roughton (Cambridge Univ.), procuring enough data on the oxygen dissociation curve and the effects of pH and temperature on blood gases to create a blood gas slide rule, made and distributed for many years by the Radiometer Co. [17] (Figure 4). By trial and error I generated a simple empiric cubic equation that matched the ODC better than any of the more complex equations [18].
After the first International Anesthesia History Association meeting in Rotterdam in 1982, Poul Astrup invited me to co-author his book, “The history of blood gases, acids and bases [19, 20].
4. Prof. F. J. W. Roughton (1899–1972), the Plummer Professor of Colloid Science at Cambridge Univ, collaborator on the accurate determination of the human oxygen dissociation curve (ODC) in the CVRI and with UC Berkeley Prof. I. Fatt On the right is the Severinghaus-Radiometer Blood Gas Calculator (or slide rule) to compute standard base excess from pH and PCO2 and solve the Henderson-Hasselbalch equation, and, on the other side, correct the effects of pH, PCO2 and temperature on the ODC. 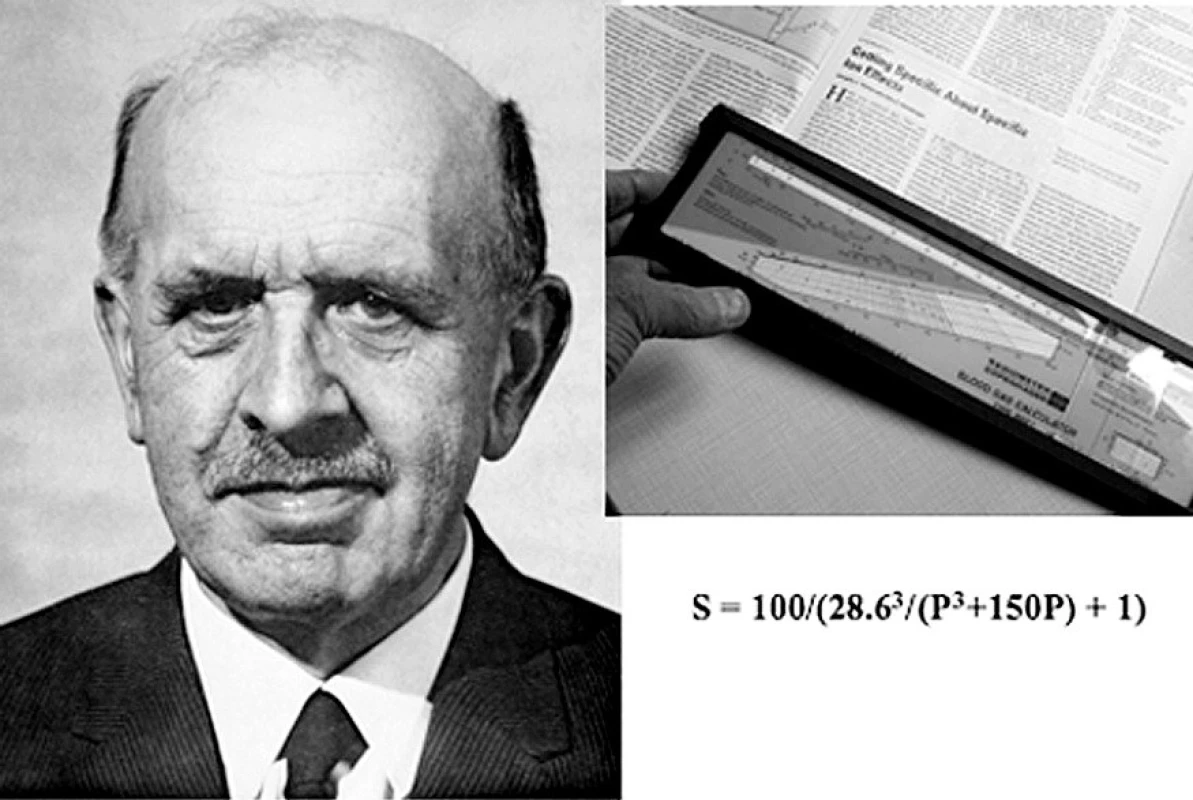
Transcutaneous Monitoring of PO2 and PCO2
In the 1960’s George Gregory and colleagues at UCSF introduced PEEP and CPAP, the famous positive pressure treatments of premature infants with atelectatic lungs. It was soon apparent that these infants were being blinded by excessive oxygen. Transcutaneous blood gas monitoring was developed primarily to avoid this oxygen-induced retrolental fibroplasia. A group led by Dietrich Lübbers (Marburg) showed that skin surface PO2 under an oxygen electrode heated to 44 °C accurately monitored arterial PO2. My laboratory group assembled a group for further studies, leading to a published international conference on these monitors. I developed a transcutaneous PCO2 electrode and showed a way to calibrate it with a known gas PCO2 to make it read arterial PCO2. I found that it was both chemically and electrically possible to combine the O2 and CO2electrodes under a single membrane. My son Ed and I designed and built 10 prototype combined O2-CO2 electrode monitor controllers used for a multi-institutional test of accuracy sponsored by the Radiometer Co. [21] (Figure 5). Most transcutaneous blood gas monitors now used the combined O2-CO2 electrode.
5. The combined transcutaneous PO2-PCO2 electrode monitoring a child postoperatively 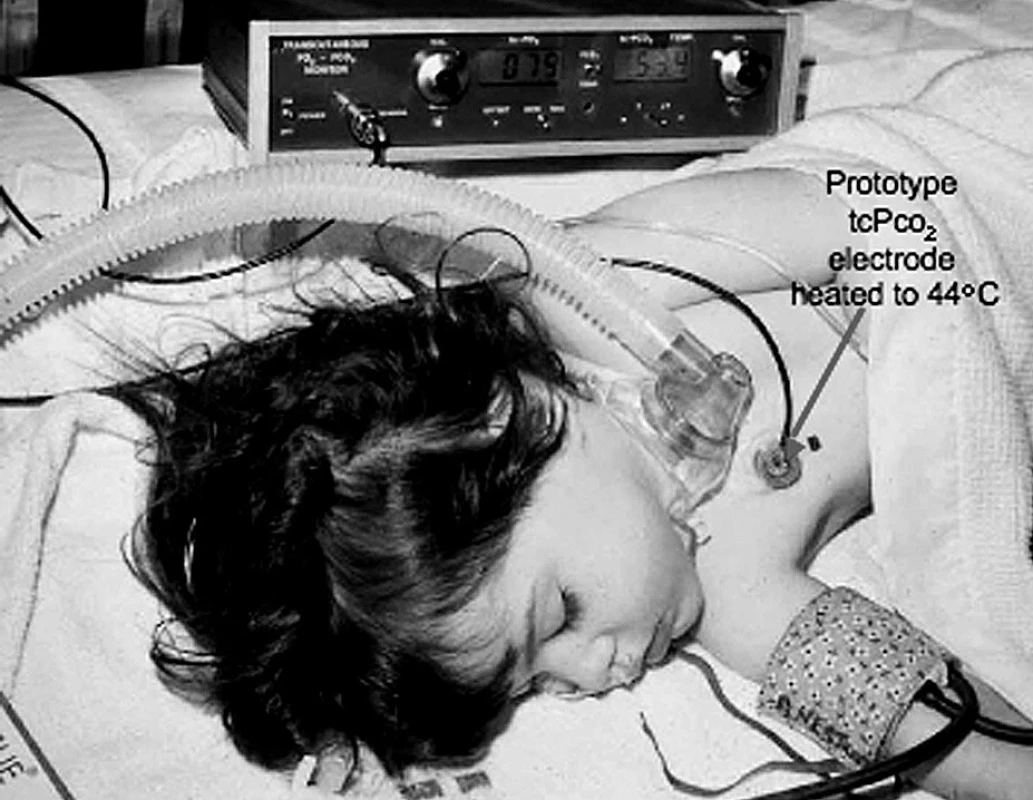
The combined electrode is heated to 44 °C to vasodilate the underlying skin to increase its blood flow. This prototype was built by Ed Severinghaus using a prototype of the combined electrode made by the author. Anesthetic and Respiratory Gas Monitoring by Multi-OR Mass Spectrometry
Between 1975 and 1985, UCSF professor of anesthesiology Gerald Ozanne, technician Bill Young, and I developed a multiplexed mass spectrometry system for use in the Moffitt Hospital’s 10 operating room suite [22]. A single central mass spectrometer sequentially analyzed, through long sampling catheters, the inspired and expired gases from each of the operating rooms, providing the anesthesiologists with minute-by-minute analyses (Figure 6). Ed worked with the team in the design and construction of the calibration and control units. The mass spectrometer terminal in each OR became a communication system for all anesthetists to communicate with each other, with the central control area, with offices and thereby via Arpanet, with the rest of the academic on-line world. This very popular device preceded the world-wide-web.
6. The author in the operating room with a terminal of the mass spectrometer system displaying the time courses of end tidal PCO2 and halothane anesthetic in his patient 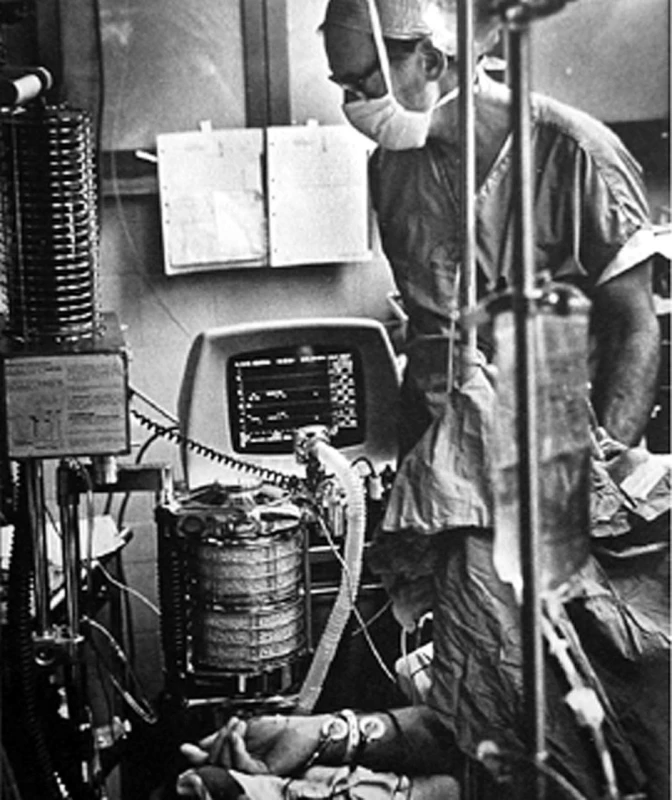
The sampling catheter, visible behind and left of the monitor, takes samples 100 ft to the multiplex valve system that selects ORs sequentially for analysis of sampled gas stored continuously in the long line. The clinical usefulness of this method of monitoring all the inspired and expired gases in all the patients became obvious within a few years. Following our designs, similar systems made by 2 companies were installed in hundreds of hospitals in the 1980s. The obvious need of all this information led several firms to develop infra red analytic devices able to recognize several different widely used fluorinated agents, and the PCO2. They added Clark type O2 electrodes but were not able to measure N2. These simpler stand-alone anesthetic and respiratory gas monitors became available in the early 1990s, ending the era of the mass spectrometers and their communication facilities.
Human Pulse Oximetry Accuracy Studies
In 1986, colleagues and I established at UCSF a Human Research Laboratory to test the accuracy of pulse oximeters in volunteers (mostly UCSF students) at oxygen saturations as low as 55% SaO2 (Figure 7). Most of the errors and differences between manufacturers only showed up at low saturation, especially in anemic individuals [23]. Our UCSF Human Research Committee agreed with the plan to use severe hypoxia largely due to our many years of experience at high altitude and our expertise in anesthesia, blood gas analysis and respiratory physiology. Our many studies helped about 30 manufacturers improve their devices and provided data for FDA approval. After 24 years of inducing severe but brief hypoxia in many thousand volunteers, we have not seen injury of any kind. Testing is still being done about twice a week.
7. Human Research Laboratory, Department of Anesthesia at UCSF, used primarily to test accuracy of various pulse oximeters at brief steps to several low volunteer oxygen saturations 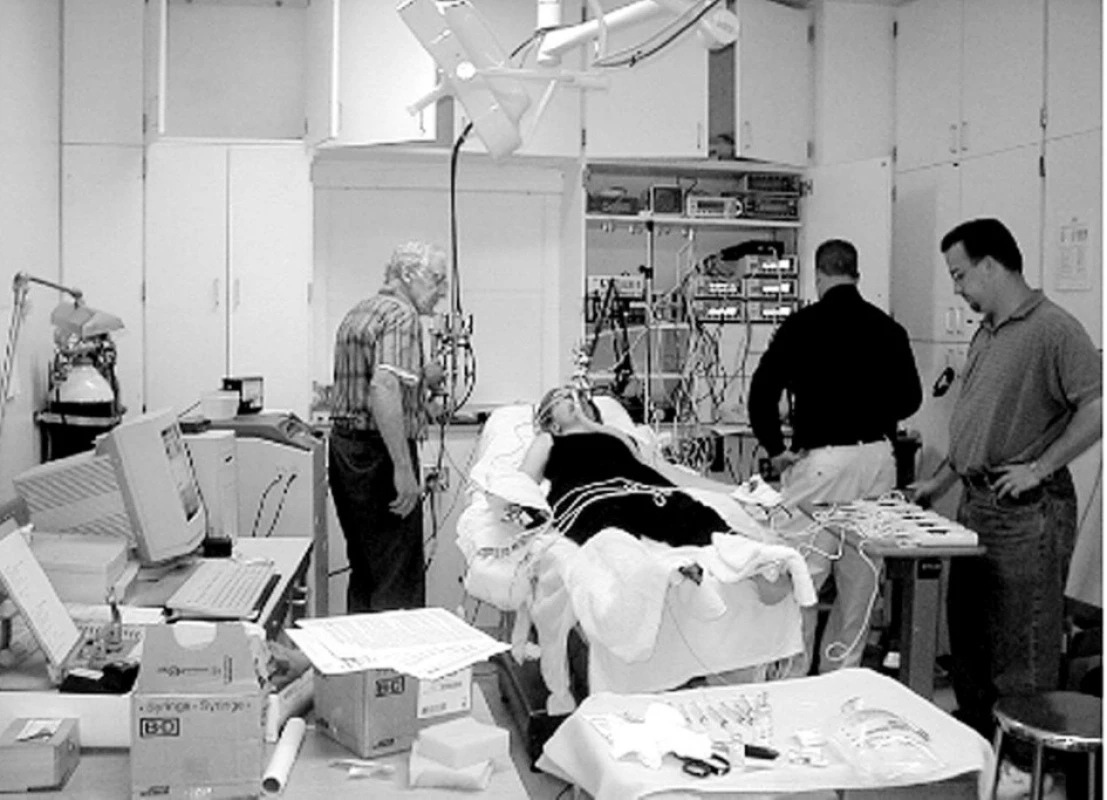
The author mixes inspired gases moment to moment based on a computer calculation of saturation using end-tidal O2 and CO2 analyzed by a mass spectrometer. Conclusion
Anesthesia research has been generously supported, primarily by the NIH, for more than 50 years. The vision of our leaders in creating and maintaining such support has made it possible for a small number of researchers to spend nearly full time in the laboratory. The most publicly evident contribution of research has been a nearly one thousand-fold improvement in the safety of anesthesia. Research has provided the tools and agents we use, transformed the teaching methods and content, and made the experience of anesthesia less traumatic. The quality of young anesthesiologists has steadily grown as the esteem of the profession has flourished, and as research penetrated every aspect of our activities. The current atrophy of academic medical funding threatens the remarkable productivity of anesthesia research.
When I finished medical school 60 years ago, anesthesia was not regarded as a scholarly pursuit by academic medicine – it is now. I submit that research was largely responsible for transforming anesthesia from a surgical service into its central role in academic medicine and its many roles in today’s health care.
Developing monitoring devices has been great fun, and gradually enhanced our proficiency although many of my ideas, schemes and gadgets were dead ends, failing to be clinically useful. Failed plans have wasted years of many young investigators involved. In translational science, failure is far more common than success.
Hopefully, our few successes will be judged as worth the huge wasted efforts. Be aware:
When technology is master
We shall reach disaster faster*
In 2008, the American Society of Anesthesiology established an annual plenary “John W. Severinghaus Lecture on Translational Science”. This paper is a revison of the published resume of that lecture [24].
* Piet Hein, Borgens, Copenhagen, 1965.
Adresa pro korespondenci:
John W. Severinghaus, MD
PO Box 974
Ross, CA 94957, USA
e-mail: jwseps@comcast.net
Sources
1. Severinghaus, J. W. Electrophrenic respirator; description of a portable all-electronic apparatus. Anesthesiology, 1951, 12, p. 123–128.
2. Severinghaus, J. W. The rate of uptake of nitrous oxide in man. J. Clin. Invest., 1954, 33, p. 1183–1189.
3. Severinghaus, J. W. The Telecor: An esophageal probe monitoring device. Anesthesiology, 1957, 18, p. 145–149.
4. Severinghaus, J. W., Stupfel, M., Bradley, A. F. Accuracy of blood pH and PCO2 determinations. J. Appl. Physiol., 1956, 9, p. 189–196.
5. Severinghaus, J. W. Effect of temperature on PCO2 and PO2 of blood in vitro. J. Appl. Physiol., 1956, 9, p. 201–204.
6. Stow, R. W., Randall, B. F. Electrical measurements of the PCO2 of blood (Abstract). Am. J. Physiol., 1954, 179, p. 678.
7. Stow, R. W., Baer, R. F., Randall, B. F. Rapid measurement of the tension of carbon dioxide in blood. Arch. Phys. Med. Rehabil., 1957, 38, p. 646–650.
8. Heyrovsky, J. Trends in Polarography. Science, 1960, 132, p. 123–130.
9. Clark, L. C. Jr, Wolf, R., Granger, D., Taylor, Z. Continuous recording of blood oxygen tensions by polarography. J. Appl. Physiol., 1953, 6, p. 189–193.
10. Severinghaus, J. W., Bradley, A. F. Electrodes for blood PO2 and PCO2 determination. J. Appl. Physiol., 1958, 13, p. 515–520.
11. Mitchell, R. A., Loeschcke, H. H., Massion, W. H., Severinghaus, J. W. Respiratory responses mediated through superficial chemosensitive areas on the medulla. J. Appl. Physiol., 1963, 18, p. 523–533.
12. Severinghaus, J. W., Mitchell, R. A., Richardson, B. W., Singer, M. M. Respiratory control at high altitude suggesting active transport regulation of CSF pH. J. Appl. Physiol., 1963, 18, p. 1155–1166.
13. Severinghaus, J. W., Chiodi, H., Eger, E. I., Brandstater, B., Hornbein, T. F. Cerebral blood flow in man at high altitude. Circ. Res., 1966, 19, p. 274–282.
14. Severinghaus, J. W., Bainton, C. R., Carcelen, A. Respiratory insensitivity to hypoxia in chronically hypoxic man. Respir. Physiol., 1966, 1, p. 308–334.
15. Sørensen, S. C., Severinghaus, J. W. Irreversible respiratory insensitivity to acute hypoxia in man born at high altitude. J. Appl. Physiol., 1968, 25, p. 217–220.
16. Severinghaus, J. W., Lassen, N. Step hypocapnia to separate arterial from tissue PCO2 in the regulation of cerebral blood flow. Circ. Res., 1967, 20, p. 272–278.
17. Severinghaus, J. W. Blood gas calculator. J. Appl. Physiol., 1966, 21, p. 1108–1116.
18. Severinghaus, J. W. Simple, accurate equations for human blood O2 dissociation computations. J. Appl. Physiol., 1979, 46, p. 599–602.
19. Astrup, P., Severinghaus, J. W. The History of Blood Gases, Acids and Bases. Copenhagen: Munksgaard, 1986.
20. Severinghaus, J. W., Astrup, P. B. History of blood gas analysis. Int. Anesthesiol. Clin., 1987, 25, p. 1–224.
21. Severinghaus, J. W. A combined transcutaneous PO2-PCO2 electrode with electrochemical HCO3 – stabilization. J. Appl. Physiol., 1981, 51, p. 1027–1032.
22. Ozanne, G. M., Young, W. G., Mazzei, W. J., Severinghaus, J. W. Multipatient anesthetic mass spectrometry: rapid analysis of data stored in long catheters. Anesthesiology, 1981, 55, p. 62–70.
23. Severinghaus, J. W., Naifeh, K. H., Koh, S. O. Errors in 14 pulse oximeters during profound hypoxia. J. Clin. Monit., 1989, 5, p. 72–81.
24. Severinghaus, J. W. Gadgeteering for Health Care: The John W. Severinghaus Lecture on Translational Science. Anesthesiology, 2009, 110, 4, p. 721–728.
Labels
Anaesthesiology, Resuscitation and Inten Intensive Care Medicine
Article was published inAnaesthesiology and Intensive Care Medicine
2010 Issue 2-
All articles in this issue
- Influence of age on the pharmacodynamic parameters of cisatracurium, rocuronium and vecuronium in males during total intravenous anaesthesia – a prospective study
- First Aid Courses (basic life support) for parents of pre-term newborns – a retrospective analysis of questionnaires
- Coupled plasma filtration adsorption in experimental septic shock
- Multimodal monitoring in neurointensive care of severe traumatic brain injury
- Tomas Kadlic Memorial – Ass. Prof. Tomas Kadlic, M. D.
- Translating Basic Science to Clinical Care
- The effect of transversus abdominis plane block on post-operative pain relief: a prospective audit
- Anaesthesiology and Intensive Care Medicine
- Journal archive
- Current issue
- Online only
- About the journal
Most read in this issue- The effect of transversus abdominis plane block on post-operative pain relief: a prospective audit
- Multimodal monitoring in neurointensive care of severe traumatic brain injury
- Tomas Kadlic Memorial – Ass. Prof. Tomas Kadlic, M. D.
- Influence of age on the pharmacodynamic parameters of cisatracurium, rocuronium and vecuronium in males during total intravenous anaesthesia – a prospective study
Login#ADS_BOTTOM_SCRIPTS#Forgotten passwordEnter the email address that you registered with. We will send you instructions on how to set a new password.
- Career

