
CENTRAL CORNEAL THICKNESS AND INTRAOCULAR PRESSURE CHANGES POST - PHACOEMULSIFICATION SURGERY IN GLAUCOMA PATIENTS WITH CATARACT
Authors:
N. Hong-Kee 1,2,3; AA. Ahmad-Marwan 2,3; M. Julieana 2,3; MF. Chong 1; HM. Vivian-Gong 1; AT. Liza-Sharmini 2,3; Y. Azhany 2,3
Authors‘ workplace:
Department of Ophthalmology, Raja Permaisuri Bainun Hospital, Perak, Malaysia
1; Department of Ophthalmology and Visual Science, School of Medical Sciences, Health Campus, Universiti Sains Malaysia, Kelantan, Malaysia
2; Hospital Universiti Sains Malaysia, Kelantan, Malaysia
3
Published in:
Čes. a slov. Oftal., 79, 2023, No. 2, p. 70-78
Category:
Original papers
doi:
https://doi.org/10.31348/2023/12
Overview
Aims: To compare the changes of central corneal thickness (CCT) and intraocular pressure (IOP) post-phacoemulsification between cataract patients with and without pre-existing glaucoma.
Materials and methods: A prospective cohort study of 86 patients with visually significant cataract: 43 with pre-existing glaucoma (GC group) and 43 without pre-existing glaucoma (CO group). CCT and IOP were evaluated at baseline (pre-phacoemulsification), as well as at 2 hours, 1 day, 1 week and 6 weeks post-phacoemulsification.
Results: The GC group have significantly thinner CCT pre-operatively (p = 0.003). There was a steady increase of CCT with the highest peak at 1 day post-phacoemulsification, followed by a steady decline of CCT and back to baseline at 6 weeks post-phacoemulsification in both groups. The GC group demonstrated a significant difference in CCT at 2 hours (mean difference 60.2 μm, p = 0.003) and 1 day (mean difference 70.6 μm, p = 0.002) post-phacoemulsification, compared to the CO group. There was a sudden increase in IOP at 2 hours post-phacoemulsification measured by GAT and DCT in both groups. This was followed by a gradual reduction of IOP, with significant reduction at 6 weeks post-phacoemulsification in both groups. However, there was no significant difference in IOP between the two groups. IOP measured by GAT and DCT showed strong correlation (r > 0.75, p < 0.001) in both groups. There was no significant correlation between GAT-IOP and CCT changes; nor between DCT-IOP and CCT changes in both groups.
Conclusions: CCT changes post-phacoemulsification in patients with pre-existing glaucoma were similar, in spite of having thinner CCT pre-operatively. IOP measurement was not affected by CCT changes in glaucoma patients post-phacoemulsification. IOP measurement using GAT is comparable with DCT post-phacoemulsification.
Keywords:
glaucoma – Phacoemulsification – intraocular pressure – central corneal thickness
INTRODUCTION
Intraocular pressure (IOP) assessment is one of the key factors in the management of glaucoma. Variations in corneal properties – central corneal thickness (CCT), corneal curvature, and hydration status – may be responsible for clinically significant inaccuracies in the measurement of IOP [1-3]. Corneal hysteresis and corneal resistance may also play a role in the inaccuracy of IOP readings with Goldmann applanation tonometry (GAT) [4]. Goldmann applanation tonometry remains the gold standard for IOP measurement. GAT is affected by CCT; IOP is no longer accurate if CCT exceeds 520 μm [1].
CCT is important in the proper classification of glaucoma, whether it is primary open-angle glaucoma (POAG), ocular hypertension (OHT), or normotensive glaucoma (NTG). Furthermore, CCT measurement is recommended by the Ocular Hypertension Study, as it is a predictive factor for conversion of OHT to POAG. A 40 μm decrease in CCT values is associated with a 70 % higher risk of developing POAG [5,6]. Thus, measurement of CCT could assist in disease diagnosis and monitoring of progression. A thicker CCT will require higher force for applanation, leading to falsely high GAT-IOP readings. Incidence of cataract in glaucoma patients is common. This is largely due to the patient’s age [7-9]. It has also been postulated that chronic instillation of topical drugs and surgical management of glaucoma may accelerate cataract formation [10-12].
Phacoemulsification is the most common surgical technique for cataract extraction surgery. Common post-phacoemulsification complications include transient elevation of IOP, corneal edema, wound leakage, loose sutures, and punctate epitheliopathy [13]. In certain cases, elevated IOP necessitates pressure-lowering medication. Direct or indirect injury to the endothelial cells may cause transient corneal edema postoperatively [14]. Transient corneal edema may result in inaccurate GAT-IOP readings. Underestimation of IOP may cause under - detection of transient IOP elevation, which can have detrimental effects in glaucoma patients. Untreated sudden spikes in IOP may lead to further mechanical damage to the nerve fiber layer in already compromised eyes [15]. However, overtreatment may lead to ocular hypotony and cause intra-axonal alteration of morphology with disruption of axoplasmic transport to the optic nerve head, accelerating further nerve fiber layer damage [16]. Accurate IOP measurement is important in controlling IOP postoperatively in glaucoma patients. The purpose of this study was to compare mean CCT and IOP pre - and post-phacoemulsification in cataract patients with and without pre-existing glaucoma. In addition, the correlations between CCT and IOP pre - and post-phacoemulsification were also studied.
MATERIALS AND METHODS
This non-randomized prospective cohort study involved 86 patients with visually significant cataract: 43 with pre-existing glaucoma (GC group) and 43 without pre-existing glaucoma (CO group). Patients were recruited from the eye clinics of Raja Permaisuri Bainun Hospital (HRPB), Perak, Malaysia, and Hospital Universiti Sains Malaysia (HUSM), Kelantan, Malaysia. This study received ethical approval from the Human Research Ethics Committee, School of Medical Sciences, Universiti Sains Malaysia and the Ethical and Medical Research Committee of the Ministry of Health, Malaysia.
Patients with pre-existing corneal pathology, high refractive aberrations, a history of refractive surgery, or who were indicated for glaucoma filtering surgery, were excluded. In this study, cataract patients without pre-existing glaucoma (CO group) were regarded as controls. In addition, those who were selected pre-operatively were excluded if they developed posterior capsular rent or zonulodialysis intra-operatively.
Written informed consent was taken for both the GC group and CO group for participation in the study and for the phacoemulsification surgery. A pre-operative assessment was conducted one week prior to phacoemulsification surgery. The eligibility of the patients was determined based on slit-lamp examination, gonioscopy, and evaluation of the posterior segment (if possible). CCT measurement was obtained using anterior segment optical coherence tomography (OCT) (Carl Zeiss Meditec Inc., Dublin, CA, USA) by a trained technician. After the CCT was measured, we proceeded with IOP measurement by the primary investigator (NHK), using GAT (GAT-IOP) and dynamic contour tonometry (DCT-IOP) (Ziemer Ophthalmic Systems, Port, Switzerland) in a sitting position between 9 : 00 and 12 : 00 in the morning.
Phacoemulsification was conducted under local (topical) anesthesia, and the posterior chamber intraocular lens was implanted. Phacoemulsification was performed by the same team of experienced surgeons at both centers, which involved 2 experienced surgeons in HRPB, and 2 experienced surgeons in HUSM. Postoperatively, patients were started on Prednisolone acetate 1 % drops 2-hourly and Ciprofloxacin drops 6-hourly for 1 week, tapering until 6 weeks. CCT, GAT-IOP, and DCT-IOP were measured at 2 hours, 1 day, 1 week, and 6 weeks post-phacoemulsification. Three readings of IOP were taken, using GAT in the sitting position, and the mean of the three readings was recorded as the IOP for subsequent analysis. DCT-IOP measurement was based on a quality index (Q score) of at least 3 or better.
Statistical analysis was conducted using SPSS version 26 (International Business Machines Corporation, New York, USA). CCT, GAT-IOP, and DCT-IOP changes were analyzed using repeated measures analysis of variance. Pearson’s correlation was used to determine the correlation between CCT and IOP changes and between GAT and DCT. A Bland–Altman plot was used to compare the two IOP measurements. A paired t-test was used to compare the mean IOP between groups.
RESULTS
A total of 86 patients (43 GC and 43 CO) were enrolled in this study. The cataract patients’ group with pre-existing glaucoma were older (Table 1). Sixteen POAG, 8 NTG, 2 pseudoexfoliation glaucoma (PXG), 13 primary angle closure glaucoma (PACG), and 4 secondary glaucoma patients were included in the GC group (Table 2). Mean CCT pre-phacoemulsification was 517.0 μm and 540.0 μm in GC and CO groups respectively. There was no significant difference in mean baseline IOP between both groups (Table 3).

++ p < 0.05 is considered statistically significant based on Pearson chi-square test,
+++ p < 0.05 is considered statistically significant based on Fisher’s exact test,
SD – Standard deviation, GC – glaucoma patient with cataract, CO – cataract patient only

GC – glaucoma patient with cataract, POAG – Primary open angle glaucoma, NTG – Normotensive glaucoma, PEXG – Pseudoexfoliation
glaucoma, PACG – Primary angle closure glaucoma

## p < 0.05 is considered statistically significant based on independence t-test
GC – glaucoma patient with cataract, CO – cataract patient only, IOP – Intraocular pressure, CDR – cup disc ratio
There was a sudden increase in CCT after phacoemulsification, which peaked at Day 1 (24 hours). However, there was a progressive reduction of CCT subsequently and it returned to preoperative thickness at 6 weeks post-phacoemulsification in both groups. Multiple paired t-tests with Bonferonni correction showed a significant difference in mean CCT between baselines (preoperative), and at 2 hours and 24 hours post-phacoemulsification in both groups. There was a significant change in mean CCT between GC and CO groups (Graph 1). There was a 26.1 % (134.7 ±95.3 μm) increase in CCT at 1 day post-phacoemulsification in the GC group, which was lower than the CO group 33.7 % (182.3 ±110.3 μm) (Table 4).

CCT – Central corneal thickness, GC – glaucoma patient with cataract, CO – cataract patient only, RM
ANOVA – repeated measure analysis of variance

##p < 0.005 is considered statistically significant based on RM ANOVA within group analysis followed by pairwise comparison with 95% confidence
interval adjustment by Bonferroni correction,
GC – glaucoma patient with cataract, CO – cataract patient only, CCT – central corneal thickness, CI – Confidence interval, RM ANOVA – Repeated
measure analysis of variance
The pre-phacoemulsification mean IOP was lower in the GC group by 0.3 mmHg compared to the CO group. Elevated IOP measured by GAT - IOP was observed after phacoemulsification and reached its peak at 2 hours post-phacoemulsification in both groups (Graph 2). Similar to CCT changes, GAT-IOP showed a progressive reduction over time. In fact, the GAT-IOP reduced even below the baseline at 6 weeks post - phacoemulsification in both groups. There was significant GAT-IOP reduction by 3.4 mmHg between 2 hours and 1 week post-phacoemulsification in the GC group. A significant reduction of 2.1 mmHg between pre-phacoemulsification and 1 week post - phacoemulsification was observed in the CO group (Table 5). In general, there was a higher mean of GAT-IOP in the GC group, but without a significant difference between the groups.

GAT-IOP – Goldmann applanation tonometry-intraocular pressure, GC – glaucoma patient with cataract,
CO – cataract patient only, RM ANOVA – repeated measure analysis of variance

## p<0.005 is considered statistically significant based on RM ANOVA within group analysis followed by pairwise comparison with 95% confidence
interval adjustment by Bonferroni correction,
GC – glaucoma patient with cataract, CO – cataract patient only, GAT – Goldmann applanation tonometry, IOP – Intraocular pressure,
CI – Confidence interval, RM ANOVA – Repeated measure analysis of variance
There was steady elevation of DCT-IOP post-phacoemulsification, that reached its peak at 2 hours in both groups (Graph 3). Similar to GAT-IOP changes, DCT-IOP showed progressive reduction over time. There was significant reduction of 3.8 mmHg between 2 hours and 1 week post-phacoemulsification in the GC group. Further IOP reduction was observed, with a significant reduction of 5.0 mmHg between 2 hours and 6 weeks post-phacoemulsification in the GC group. A significant reduction of 2.0 mmHg between pre-phacoemulsification and 1 week post-phacoemulsification was observed in the CO group. There was a higher reduction of 2.9 mmHg between pre-phacoemulsification and 6 weeks post-phacoemulsification (Table 6). However, there was no significant difference of mean DCT-IOP between the groups.

DCT-IOP – Dynamic contour tonometry-intraocular pressure, GC – glaucoma patient with cataract,
CO – cataract patient only, RM ANOVA – repeated measure analysis of variance

##p<0.005 is considered statistically significant based on RM ANOVA within group analysis followed by pairwise comparison with 95% confidence
interval adjustment by Bonferroni correction,
GC – glaucoma patient with cataract, CO – cataract patient only, DCT – Dynamic contour tonometry, IOP – Intraocular pressure, RM ANOVA
– Repeated measure analysis of variance
There was a strong correlation between mean GAT-IOP and DCT-IOP in both groups pre - and post-phacoemulsification (Table 7). However, there was no correlation between CCT changes, GAT changes and DCT changes (Table 8).
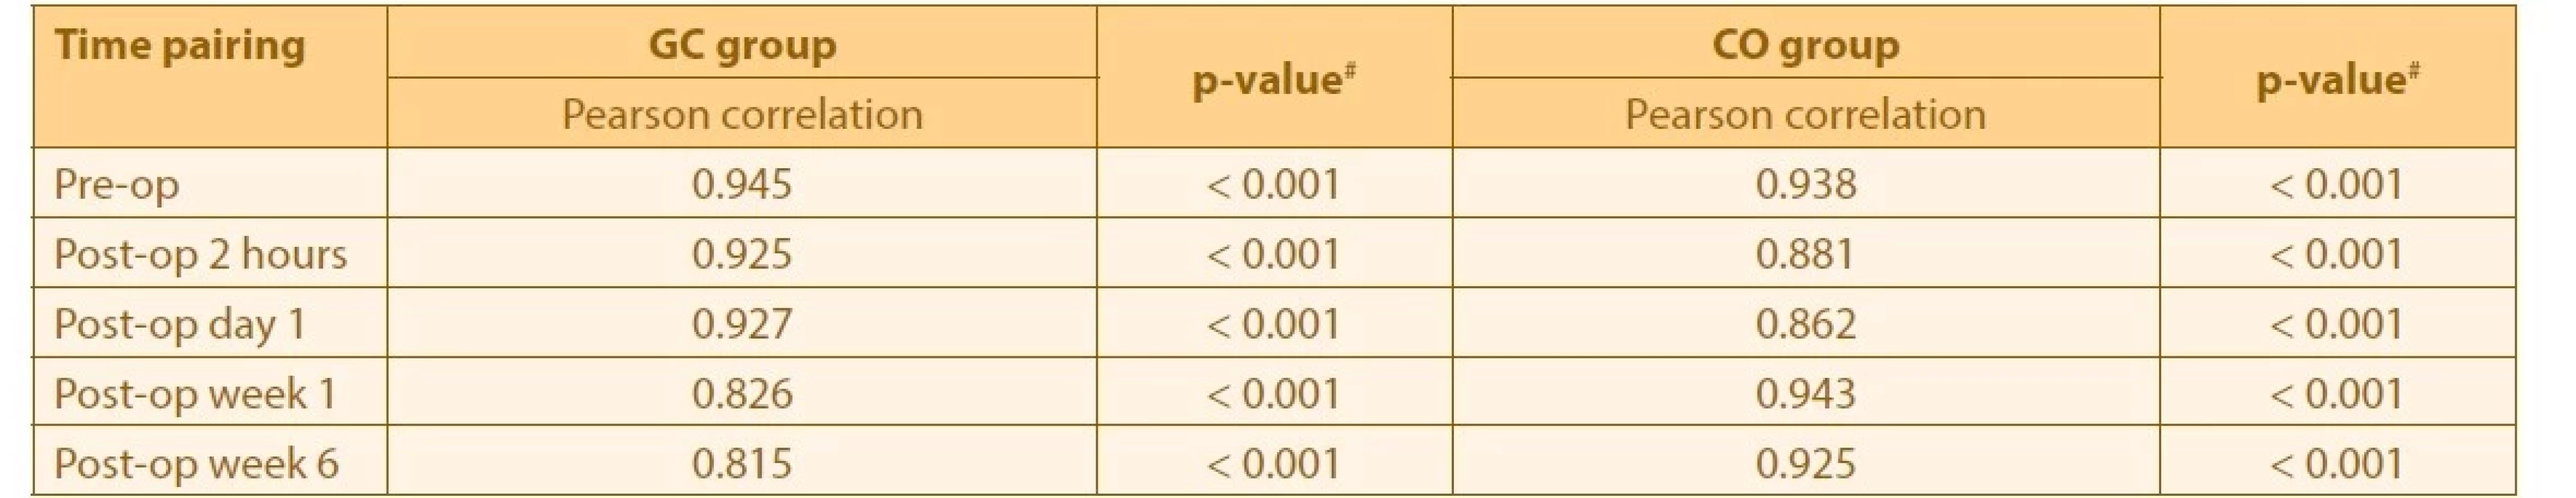
GAT – Goldmann applanation tonometry, IOP – Intraocular pressure, DCT – Dynamic contour tonometry, GC – glaucoma patient with cataract,
CO – cataract patient only

2H is 2-hour post-op, D1 is Day 1 post-op, W1 is Week 1 post-op, W6 is Week 6 post-op,
CCT – Central corneal thickness, IOP – Intraocular pressure, GAT – 015 Goldmann applanation tonometry, DCT – Dynamic contour tonometry
It is worth mentioning that, throughout this study, neither GC group nor CO group needed any systemic IOP-lowering agents, in view of all our patients showing an acceptable range of IOP readings. Postoperatively, patients continued their previous antiglaucoma medications.
DISCUSSION
Mean CCT pre-phacoemulsification was 23.0 μm, thinner in cataract patients with pre-existing glaucoma, compared to those without pre-existing glaucoma in the present study. It has been reported that glaucoma patients have thinner CCT compared to non-glaucoma patients [17]. Thinner CCT was associated with more severe glaucoma [17,18]. In this study, the majority of eyes had moderate to severe glaucoma. In addition, the glaucoma patients were older than the non-glaucoma patients. There was a significant association between age and CCT [19-21].
Cataract patients with pre-existing glaucoma tend to have a significantly thinner CCT. However, the higher prevalence of diabetes mellitus among the cataract patients without pre-existing glaucoma may have contributed to their thicker CCT. CCT was 6.5 μm thicker in diabetes mellitus patients compared to non-diabetic patients [22].
Phacoemulsification causes postoperative corneal edema, leading to increased CCT. In spite of thinner CCT in cataract patients with pre-existing glaucoma, the changes in CCT post-phacoemulsification were similar in cataract patients with and without pre-existing glaucoma. As expected, there was a sudden increase in CCT at 2 hours and it peaked at 24 hours post-phacoemulsification. Similar findings were reported from previous studies by Tao A et al., Bolz M et al., Salvi SM et al., Herr A et al., and Fuest M et al., which reported significant increased CCT after 1 day post-phacoemulsification [23-27].
This was followed by a steady reduction in CCT over time, which returned to pre-phacoemulsification level at 6 weeks post-surgery. In our study, a longer duration for CCT to return to its pre-phacoemulsification level was observed. While most previous studies reported CCT returned to baseline after 1 week [23-25], a study was done by Noronha D et al., where the CCT returned to baseline at 1 month post-surgery [28]. Cetinkaya et al. studied post-phacoemulsification in ocular hypertensive patients and reported a longer time to reach baseline CCT, which was 3 months [29]. The longer duration of the CCT to return to baseline in our study may have been due to a larger quantum of CCT increment at 2 hours post-phacoemulsification as compared to other studies. However, the Scheimpflug camera system was used in those previous studies, which may not be comparable to our technique of CCT measurement using the anterior segment OCT [30]. In addition, the phacoemulsification was conducted by a panel of surgeons at a different hospital. Those surgeons may have their own techniques, preferences, phacoemulsification settings and levels of expertise [31-35]. Ideally, a single surgeon from each hospital should be responsible for conducting the surgeries. Moreover, the CCT may also be affected by the type of glaucoma. In this study, although the majority were POAG patients, NTG and PXG patients were also included. NTG and PXG patients have been reported to have thinner CCT compared to POAG and to the normal population [36,37]. In addition, a lower endothelial cell count has been observed in glaucoma patients [38,39]. There was a significantly longer duration of cataract surgery overall among cataract patients with pre-existing glaucoma in the present study. This is perhaps due to the greater instrumentation and manipulation needed in patients with pre-existing glaucoma. The effective phacoemulsification time was also longer in these patients. Unfortunately, the endothelial cell count was not included in the present study. Inclusion of diabetes mellitus patients in both groups may cause a more significant increase of mean CCT [40].
CCT is known to affect the IOP measurement using GAT [1]. Thinner CCT is associated with a falsely low IOP [41]. In this study, cataract patients with pre-existing glaucoma recorded lower IOP pre-phacoemulsification compared to those without pre-existing glaucoma. This is not surprising, as only glaucoma patients with well-controlled IOP were included in the present study. In addition, glaucoma patients with systemic comorbidities, especially systemic hypertension, were also included. However, as part of preoperative evaluation, their systemic blood pressure had to be controlled by systemic antihypertensive drugs, which can further lower the IOP [42].
In the present study, there were similar changes in IOP measured by GAT and DCT post-phacoemulsification. There was an acute spike of IOP at 2 hours post-phacoemulsification, followed by a steady decline in IOP. A higher acute increase in IOP was observed in cataract patients with pre-existing glaucoma post-phacoemulsification. This was expected, as these patients required relatively more manipulations, leading to more inflammation and a higher volume of viscoelastic usage, which contributes to the spike in pressure. However, once reabsorption of viscoelastic was complete, the IOP was reduced. The mean IOP was lower at 6 weeks post-phacoemulsification compared to pre-phacoemulsification. Phacoemulsification is known to cause transient IOP reduction, due to the anatomical changes, as reported by Poley et al., Shingleton et al., and Kim et al. [43-45].
However, there was no significant difference in mean IOP (measured by GAT and DCT) between cataract patients with and without pre-existing glaucoma. In addition, although the changes in CCT were similar to IOP changes post-phacoemulsification, there was no significant correlation between CCT and IOP. Surprisingly, there was also no significant difference in mean IOP measured by GAT and DCT. This may have been due to the relatively small sample size, or to the significantly thinner CCT in the GC group compared to the CO group, which resulted in underestimation of GAT-IOP compared to true IOP. After surgery, DCT-IOP revealed significantly higher IOP at 2 hours and 1 day post-phacoemulsification in both groups. As GAT is known to deviate due to changes in corneal biomechanical property, this showed that increased CCT post-phacoemulsification as a result of corneal edema caused underestimation of GAT-IOP in the acute post-op period (especially at 2 hours and 1 day post-phacoemulsification), and this significant difference was larger in the GC group compared to the CO group.
In this study, we measured the IOP using two instruments, GAT and DCT, to ascertain the difference when the cornea was edematous. However, we did not measure the cornea hysteresis and cornea resistance factor, which are important factors in assessing the corneal biomechanical property.
Both groups showed a significant IOP reduction at 6 weeks post-phacoemulsification. This proved the benefit of cataract surgery in controlling the IOP in patients with simultaneous glaucoma and cataract pathologies. We also suggested that IOP monitoring in the early postoperative phase is feasible without the concurrent CCT, as the measurement changes are not crucial and pre-measurement thickness will be regained after 6 weeks.
CONCLUSION
There was a significant difference in mean CCT between the GC and CO groups over time. There was a significant increase in CCT in both groups, peaking at 1 day post-phacoemulsification, although patients with pre-existing glaucoma had thinner CCT pre-operatively. There was no correlation between CCT and IOP changes post-phacoemulsification in either group. IOP measurement was not affected by CCT changes in glaucoma patients post-phacoemulsification.
The authors have no conflict of interest in this work.
Funds: USM Short-term Grant: 304/PPSP/61313008
Received: September 19, 2022
Accepted: January 2, 2023
Available on-line: March 30, 2023
First author:
Dr. Ng Hong-Kee
Corresponding author:
Assoc. Prof. Dr. Yaakub Azhany, MD, MMed.
Department of Ophthalmology and Visual Science, School of Medical Sciences,
Health Campus, Universiti Sains Malaysia
6150 Kota Bharu
Kelantan, Malaysia
E-mail: azhany@usm.my
Sources
1. Ehlers N, Bramsen T, Sperling S. Applanation tonometry and central corneal thickness. Acta Ophthalmol. (Copenh) 1975;53(1):34-43.
2. Mark HH. Corneal curvature in applanation tonometry. Am J Ophthalmol. 1973;76(2):223-224.
3. McMillan F, Forster RK. Comparison of MacKay-Marg, Goldmann, and Perkins tonometers in abnormal corneas. Arch Ophthalmol. 1975;93(6):420-424.
4. Yu AY, Duan SF, Zhao YE, et al. Correlation between corneal biomechanical properties, applanation tonometry and direct intracameral tonometry. Br J Ophthalmol 2012;96(5):640-644.
5. Whitacre MM, Stein RA, Hassanein K. The effect of corneal thickness on applanation tonometry. Am J Ophthalmol. 1993;115(5):592-596.
6. Gordon MO, Beiser JA, Brandt JD, et al. The ocular hypertension treatment study: Baseline factors that predict the onset of primary open-angle glaucoma. Arch Ophthalmol. 2002;120(6):714-720.
7. Taylor A, Jacques PF, Epstein EM. Relations among aging, antioxidant status, and cataract. Am J Clin Nutr. 1995;62(6 Suppl):1439S-1447S.
8. Thylefors B, Negrel AD. The global impact of glaucoma. Bulletin of the World Health Organization. 1994;72(3):323-326. Epub 1994/01/01.
9. Forrester JV. Aging and vision. Bull World Health Organ 1997;81(10):809-810.
10. Skalka HW, Prchal JT. Effect of corticosteroids on cataract formation. Arch Ophthalmol. 1980;98(10):1773-1777.
11. Hylton C, Congdon N, Friedman D, et al. Cataract after glaucoma filtration surgery. Am J Ophthalmol. 2003;135(2):231-232.
12. Holekamp NM, Shui Y-B, Beebe DC. Vitrectomy surgery increases oxygen exposure to the lens: a possible mechanism for nuclear cataract formation. Am J Ophthalmol. 2005;139(2):302-310.
13. Tinley CG, Frost A, Hakin KN, et al. Is visual outcome compromised when next day review is omitted after phacoemulsification surgery? A randomised control trial. Br J Ophthalmol. 2003;87(11):1350 - 1355.
14. Mishima S. Clinical investigations on the corneal endothelium-XXXVIII Edward Jackson Memorial Lecture. Am J Ophthalmol. 1982;93(1):1-29.
15. Yu D-Y, Cringle SJ, Balaratnasingam C, et al. Retinal ganglion cells: energetics, compartmentation, axonal transport, cytoskeletons and vulnerability. Prog Retin Eye Res. 2013;36 : 217-246.
16. Minckler DS, Bunt AH, Klock IB. Radioautographic and cytochemical ultrastructural studies of axoplasmic transport in the monkey optic nerve head. Invest Ophthalmol Vis Sci. 1978;17(1):33-50.
17. Jimenez-Rodriguez E, Lopez-de-Cobos M, Luque-Aranda R, et al. [Relationship between central corneal thickness, intraocular pressure and severity of glaucomatous visual field loss]. Arch Soc Esp Oftalmol. 2009;84(3):139-143.
18. Sullivan-Mee M, Gentry JM, Qualls C. Relationship between asymmetric central corneal thickness and glaucomatous visual field loss within the same patient. Optom Vis Sci. 2006;83(7):516 - 519.
19. Aghaian E, Choe JE, Lin S, et al. Central corneal thickness of Caucasians, Chinese, Hispanics, Filipinos, African Americans, and Japanese in a glaucoma clinic. Ophthalmology. 2004;111(12):2211-2219.
20. Brandt JD, Beiser JA, Kass MA, et al. Central corneal thickness in the Ocular Hypertension Treatment Study (OHTS). Ophthalmology 2001;108(10):1779-1788.
21. Huang Y, Zhang M, Huang C, et al. Determinants of postoperative corneal edema and impact on goldmann intraocular pressure. Cornea 2011;30(9):962-967.
22. Su DH, Wong TY, Wong WL, et al. Diabetes, hyperglycemia, and central corneal thickness: the Singapore Malay Eye Study. Ophthalmology. 2008;115(6):964-968.
23. Tao A, Chen Z, Shao Y, et al. Phacoemulsification induced transient swelling of corneal Descemet’s Endothelium Complex imaged with ultra-high resolution optical coherence tomography. PLoS One. 2013;8(11):e80986.
24. Bolz M, Sacu S, Drexler W, et al. Local corneal thickness changes after small-incision cataract surgery. J Cataract Refract Surg 2006;32(10):1667-1671.
25. Salvi SM, Soong TK, Kumar BV, Hawksworth NR. Central corneal thickness changes after phacoemulsification cataract surgery. Journal of Cataract & Refractive Surgery. 2007 Aug 1;33(8):1426 - 1428.
26. Herr A, Remky A, Hirsch T, et al. Tonometry in corneal edema after cataract surgery: dynamic contour tonometry versus Goldmann applanation tonometry. Clin Ophthalmol. 2013;7 : 815-819.
27. Fuest M, Mamas N, Walter P, et al. Tonometry in Corneal Edema after Cataract Surgery: Rebound versus Goldmann Applanation Tonometry. Curr Eye Res. 2014;39(9):902-907
28. Noronha D, D’souza M. Changes in Central corneal thickness before and after phacoemulsification cataract surgery. J Clin Ophthalmol. 2020;4(4):300-302.
29. Cetinkaya S, Dadaci Z, Yener HI, Acir NO, Cetinkaya YF, Saglam F. The effect of phacoemulsification surgery on intraocular pressure and anterior segment anatomy of the patients with cataract and ocular hypertension. Indian J Ophthalmol. 2015 Sep;63(9):743-5.
30. O’Donnell C, Hartwig A, Radhakrishnan H. Comparison of central corneal thickness and anterior chamber depth measured using LenStar LS900, Pentacam, and Visante AS-OCT. Cornea. 2012;31(9):983-988.
31. Doors M, Berendschot TT, Touwslager W, et al. Phacopower modulation and the risk for postoperative corneal decompensation: a randomized clinical trial. JAMA Ophthalmol. 2013;131(11):1443 - 1450.
32. Davis EA, Lindstrom RL. Corneal thickness and visual acuity after phacoemulsification with 3 viscoelastic materials. J Cataract Refract Surg. 2000;26(10):1505-1509.
33. Helvacioglu F, Sencan S, Yeter C, et al. Outcomes of torsional microcoaxial phacoemulsification using tips with 30-degree and 45-degree aperture angles. J Cataract Refract Surg. 2014;40(3):362-368.
34. Park J, Yum HR, Kim MS, et al. Comparison of phaco-chop, divide - and-conquer, and stop-and-chop phaco techniques in microincision coaxial cataract surgery. J Cataract Refract Surg. 2013;39(10):1463-1469.
35. Vasavada AR, Praveen MR, Vasavada VA, et al. Impact of high and low aspiration parameters on postoperative outcomes of phacoemulsification: randomized clinical trial. J Cataract Refract Surg. 2010;36(4):588-593.
36. Kitsos G, Gartzios C, Asproudis I, et al. Central corneal thickness in subjects with glaucoma and in normal individuals (with or without pseudoexfoliation syndrome). Clin Ophthalmol. 2009;3 : 537-542.
37. Pang CE, Lee KY, Su DH, et al. Central corneal thickness in Chinese subjects with primary angle closure glaucoma. J Glaucoma. 2011;20(7):401-404.
38. Urban B, Bakunowicz-Lazarczyk A, Michalczuk M, et al. Evaluation of corneal endothelium in adolescents with juvenile glaucoma. J Ophthalmol. 2015;2015 : 895428.
39. Tomaszewski BT, Zalewska R, Mariak Z. Evaluation of the endothelial cell density and the central corneal thickness in pseudoexfoliation syndrome and pseudoexfoliation glaucoma. J Ophthalmol. 2014;2014 : 123683.
40. Hugod M, Storr-Paulsen A, Norregaard JC, et al. Corneal endothelial cell changes associated with cataract surgery in patients with type 2 diabetes mellitus. Cornea. 2011;30(7):749-753.
41. Doughty MJ, Zaman ML. Human corneal thickness and its impact on intraocular pressure measures: a review and meta-analysis approach. Surv Ophthalmol. 2000;44(5):367-408.
42. Khawaja AP, Chan MPY, Broadway DC, et al. Systemic Medication and Intraocular Pressure in a British Population: The EPIC-Norfolk Eye Study. Ophthalmology. 2014;121(8):1501-1507.
43. Poley BJ, Lindstrom RL, Samuelson TW, et al. Intraocular pressure reduction after phacoemulsification with intraocular lens implantation in glaucomatous and nonglaucomatous eyes: evaluation of a causal relationship between the natural lens and open-angle glaucoma. J Cataract Refract Surg. 2009;35(11):1946-1955.
44. Shingleton BJ, Pasternack JJ, Hung JW, et al. Three and five year changes in intraocular pressures after clear corneal phacoemulsification in open angle glaucoma patients, glaucoma suspects, and normal patients. J Glaucoma. 2006;15(6):494-498.
45. Kim M, Park KH, Kim TW, et al. Anterior chamber configuration changes after cataract surgery in eyes with glaucoma. Korean J Ophthalmol. 2012;26(2):97-103.
Labels
OphthalmologyArticle was published in
Czech and Slovak Ophthalmology
2023 Issue 2
Most read in this issue
- FORMS OF OCULAR LARVAL TOXOCARIASIS IN CHILDHOOD. A REVIEW
- CHANGE OF SURGICALLY INDUCED CORNEAL ASTIGMATISM AND POSITION OF ARTIFICIAL INTRAOCULAR LENS OVER TIME
- VISUAL OUTCOMES, CONTRAST SENSITIVITY, AND SATISFACTION WITH MULTIFOCAL INTRAOCULAR LENS BLENDED TECHNIQUE: LATE MID-TERM RESULTS
- CENTRAL CORNEAL THICKNESS AND INTRAOCULAR PRESSURE CHANGES POST- PHACOEMULSIFICATION SURGERY IN GLAUCOMA PATIENTS WITH CATARACT