
Serum S100B Protein as a Molecular Marker of Severity in Traumatic Brain Injury in Children
Authors:
J. Žurek 1; L. Bartlová 2; L. Marek 1; M. Fedora 1
Authors‘ workplace:
LF MU a FN Brno
Klinika dětské anesteziologie a resuscitace
1; LF MU a FN Brno
Klinika dětské neurologie
2
Published in:
Cesk Slov Neurol N 2010; 73/106(1): 37-44
Category:
Original Paper
Overview
Objectives:
S100B is a protein biomarker that reflects CNS injury. The aims of the current study were to investigate correlations between the initial level of serum S100B protein and mortality and computerized tomography (CT) findings, as well as to establish whether there is an association between S100B and Glasgow outcome scale (GOS) after six months.
Methods:
This prospective study enrolled 43 patients with traumatic brain injury (TBI), verified by computerized tomography and categorized by Marshall classification. Venous blood samples were taken on admission and every 24 h for a maximum of six consecutive days. The outcome was evaluated six months after TBI using the Glasgow outcome scale (GOS) in all patients.
Results:
GOS was taken as principal end‑point for all predictive analyses. We demonstrated statistically significant relationships between groups of patients with GOS = 1 and GCS ≤ 8 (p = 0.046), Marshall classification score > II (p 1; p = 0.03). Levels of S100B were elevated in patients with some specific types of injury, namely intracranial bleeding, subdural haematoma and oedema.
Conclusion:
The level of S100B was confirmed as a clinically valuable indicator of severity of injury and is proposed as an effective predictor of risk outcome (GOS = 1).
Key words:
protein S100 – vážný úraz hlavy – výsledek – děti
Introduction
Accidents are a major cause of morbidity and mortality in children aged a year or more, and traumatic brain injury (TBI) is the injury most responsible for deaths [1]. Case series from multiple trauma centres report that 75–97% of trauma deaths in children result from TBI [2].
Despite significant progress in cerebral monitoring, it remains difficult to quantify the extent of primary trauma in TBI, to monitor secondary changes, and to predict neurological outcome with the dia-gnostic tools available to us today. Standard methods of addressing prognoses of severity of initial brain injury and anticipating the onset of secondary injury have included neurological examination, neuro‑imaging studies, intracranial pressure monitoring, electrodiagnostic testing, and transcranial dopplers.
However, the use of protein biomarkers for the detection of injury and prediction of outcomes has been attracting increasing clinical interest. These markers have been investigated in serum, cerebrospinal fluid (CSF) and even urine. Most of the protein biomarkers that have been investigated to date are mediators of the injury response or subsequent cellular damage or death [3].
The S100 proteins are a family of dimeric cytosolic calcium‑binding proteins made up of an alpha and a beta isomer. S100 proteins are found in abundance in the astroglial and Schwann cells and have also been found in certain tumours, such as schwannoma, glioma, melanoma, and neuroblastoma [4,5]. Elevations in serum S100B protein levels have been reported to reflect injury to the brain and increased permeability of the blood‑brain barrier [6].
We believe that initial serum S100B levels (simple blood test) can provide valuable diagnostic indications of the structural damage at an early stage of severe TBI, especially in patients lacking reliable clinical (sedated and intubated), imaging (normal or minimal damage on initial computerized tomography) or neurophysiological evaluation, and may assist in eventual prognosis. Serial measurements of S100B levels can also monitor secondary events and contribute to better day‑to‑day assessment and treatment.
The aims of the current study were to study correlations between the initial level of serum S100B protein and both mortality and the computerized tomography (CT) findings that indicate radiologically visible brain damage, as well as to investigate whether there is an association between S100B and the Glasgow outcome scale (GOS).
Methods
This prospective cohort study consecutively enrolled 43 children of < 19 yrs of age with severe TBI brought to the University Children’s Hospital, Brno, from June 2007 through November 2008. All the patients were monitored continuously in PICU and received standard neuro‑intensive care, including intubation and mechanical ventilation, haemodynamic monitoring, and intracranial pressure monitoring based on TBI therapeutic protocol. Intracranial hypertension was treated progressively by use of a standard step‑wise protocol that included sedation, paralysis, mild hyperventilation (target paCO2 32–35 mmHg), osmotherapy with mannitol, and use of barbiturates. Cerebral perfusion pressure was maintained at 60 mmHg (50 mmHg in infants) by lowering intracranial pressure to 20 mmHg (15 mmHg in infants) and by maintaining mean arterial blood pressure at 80 mmHg (70 mmHg in infants).
The Glasgow coma scale [7] was based on evaluation of the emergency measures taken, although without consideration of pharmacological interventions. Initial CT scans obtained on admission were analyzed after the classification established by Marshall et al [8] into the following categories: grade I, no visible intracranial pathology seen on CT; grade II, cisterns present with midline shift 0–5mm, lesion densities present, but no high ‑ or mixed‑density lesion larger than 25ml, may include bone fragments and foreign bodies; grade III, cisterns compressed or absent with midline shift 0–5mm, no high ‑ or mixed‑density lesion larger than 25ml; grade IV, midline shift more than 5mm, no high ‑ or mixed‑density lesion larger than 25ml; grade V, any lesion surgically evacuated; and grade VI, high ‑ or mixed‑density lesion larger than 25ml, not surgically evacuated.
Venous blood samples to determine levels of S100 were always taken on admission, then every day until a maximum of six days of hospitalization. Samples were centrifuged and serum was frozen to –70°C for analysis. S100B was measured immuno‑luminometrically with a commercially available kit (Elecsys® analyzer, Roche Diagnostics).
Clinical outcome was measured after six months using the GOS [9] with its ratings of 1 (death), 2 (vegetative state), 3 (severe disability), 4 (moderate disability), and 5 (good outcome), based on electro‑encephalography and neurological examination. The person who carried out the assays and decided upon outcome was completely blinded to the clinical information.
The study protocol and informed consent approach were approved by the ethicscommittee of the University Hospital, Brno. Parents provided written informed consent for their children to participate in this trial.
Statistical analysis
The standard methods of nonparametric statistics were employed for the analysis. Categorical data were described by frequency analysis of categories, continuous data using median and percentiles. Relationships between categorical variables were analyzed by means of maximum likelihood chisquare test; the Mann‑Whitney U test was used for comparison of values of continuous variables between categories of patients.
Receiver operating characteristic curves (ROC) were applied for the analysis of the predictive power of injury characteristics, biochemical parameters and initial CT diagnostics. GOS score = 1 was taken as principal study endpoint for the purposes of predictive analyses.
Analyses were performed using Statistica 8 (StatSoft, Inc.) and SPSS 17 (SPSS Inc.).
Results
GOS was taken as principal end‑point for all predictive analyses, i.e. those analyses that have been performed in order to assess the predictive potential of a set of characteristics, both of patient and of injury.
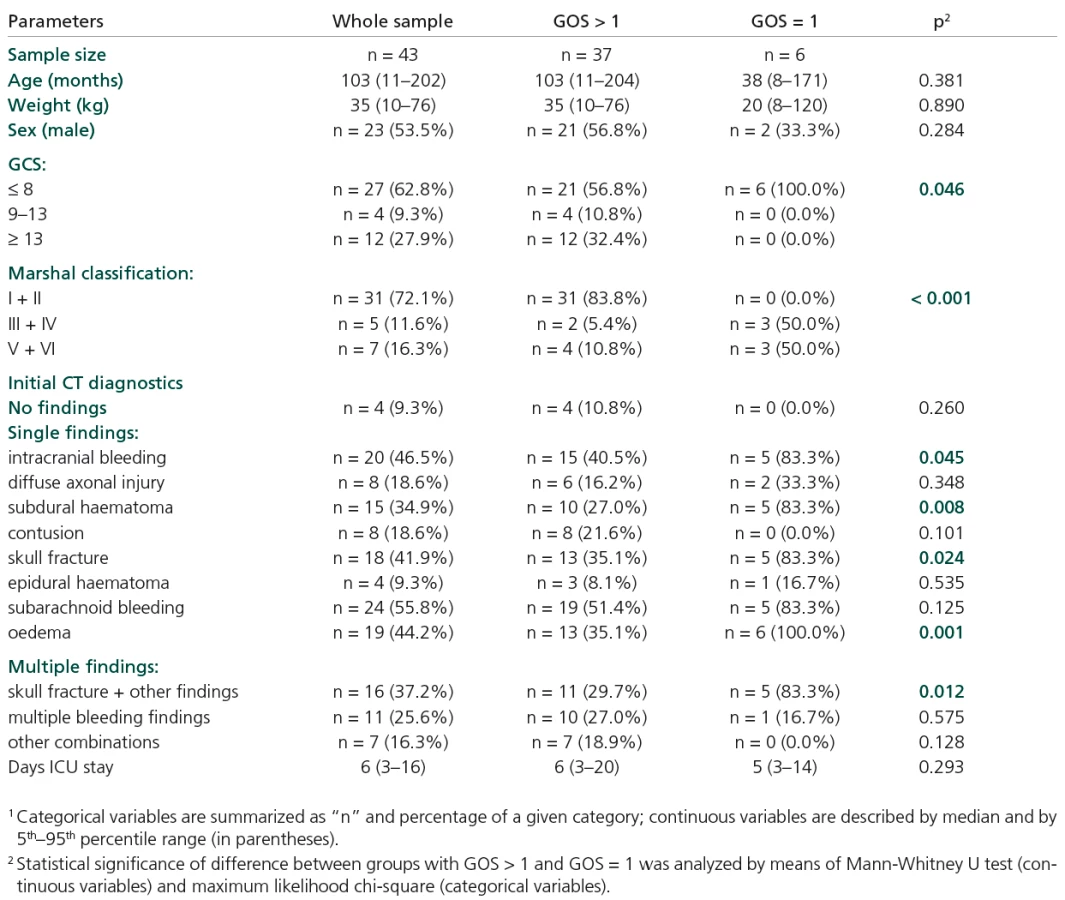
A total of 43 children (53.5% boys, 46.5% girls) with TBI were enrolled. Table 1 shows summary statistics of the initial characteristics of the injured children. Common descriptors such as age, sex and weight are not related to the final GOS values. Similarly, no significant correlation between age and S100B initial values was observed (Figure 1).

Glasgow outcome scale
Table 1 shows some statistically significant relationships between certain descriptors and a group of patients with GOS = 1:
- GCS ≤ 8 (all patients with GOS = 1 belong to this category, p = 0.046),
- Marshall classification score > II (no patient with GOS = 1 has Marshall score I or II, p < 0.001),
- Increased incidence of some type of injury, as diagnosed by CT scan:
- intracranial bleeding (p = 0.045), subdural haematoma (p = 0.008), skull fracture (p = 0.024),
- subarachnoid bleeding, oedema (p = 0.001),
- multiple CT findings, namely skull fracture in combination with some other injury type (p = 0.012).
All the parameters that significantly distinguished patients with GOS = 1 from the others (Table 1) serve as candidates for effective predictors.
Dynamics of S100B
Figure 2 shows a statistically significant decrease in S100B values in the group of patients with final GOS > 1. This significant decrease started during the second day of hospitalization and continued for the whole follow‑up period of six days. Initially, 91.7% of patients exceeded the cut‑off level of 0.105 µg/l, while by the end of the follow‑up period this had become only 6.5% (p < 0.001). On the other hand, the cohort with GOS = 1 did not exhibit a statistically significant decrease in S100B values, although in median value the level of S100B decreased within the period (from 1.6 µg/l to 0.27 µg/l). The level of S100B remained significantly higher in the risk group (GOS = 1) in comparison with the GOS > 1 group for the whole follow‑up period, including initial value on the first day (Table 2). The decrease of S100B level in the risk group of patients was not significant in comparison with the initial value (Figure 2). Based on time‑related profiles, we related the subsequent follow‑up values of S100B to the initial level in pair‑wise calculated ratios. Only S100B in second day/initial S100B ratio significantly differentiated the two groups of patients compared (with GOS = = 1 and with GOS >1; p = 0.03) (Figure 3, Table 2).


Levels of S100B and CT findings
Levels of S100B were elevated in patients with some specific types of injury, namely intracranial bleeding, subdural haematoma and oedema (Table 3). Increased S100B levels (on both first and second days of hospitalization) were found in patients with GCS ≤ 8; p = 0.024 and p = 0.031 (Table 4).


Combined injury (skull fracture plus some other type) is significantly associated with GCS and Marshall classification score (Table 3). Apart from this relationship, the GCS score appears to be rather independent of injury type, while increased Marshall classification is also associated with skull fracture, subdural and epidural haematoma (Table 3).
ROC analysis
Increased initial values of S100B also contributed to risk prediction, but not at the cut‑off level > 0.105 µg/l. In fact, this level appears to be too low to serve as an effective cut‑off point. In first day of hospitalization it was exceeded by 100% of the risk patients (GOS = 1) but also by 91.7% of the others. Consequently, the initial level of S100B attained only a very low specificity at this point (Table 5). Objective ROC analysis revealed level first day > 1.28 µg/l, sensitivity 83.3 and specificity 81.2%; AUC = 0.752; p = 0.032 and second day of hospitalization >0.54 µg/l, sensitivity 83.3 and specificity 97.2; AUC = 0.880; p = 0.003.
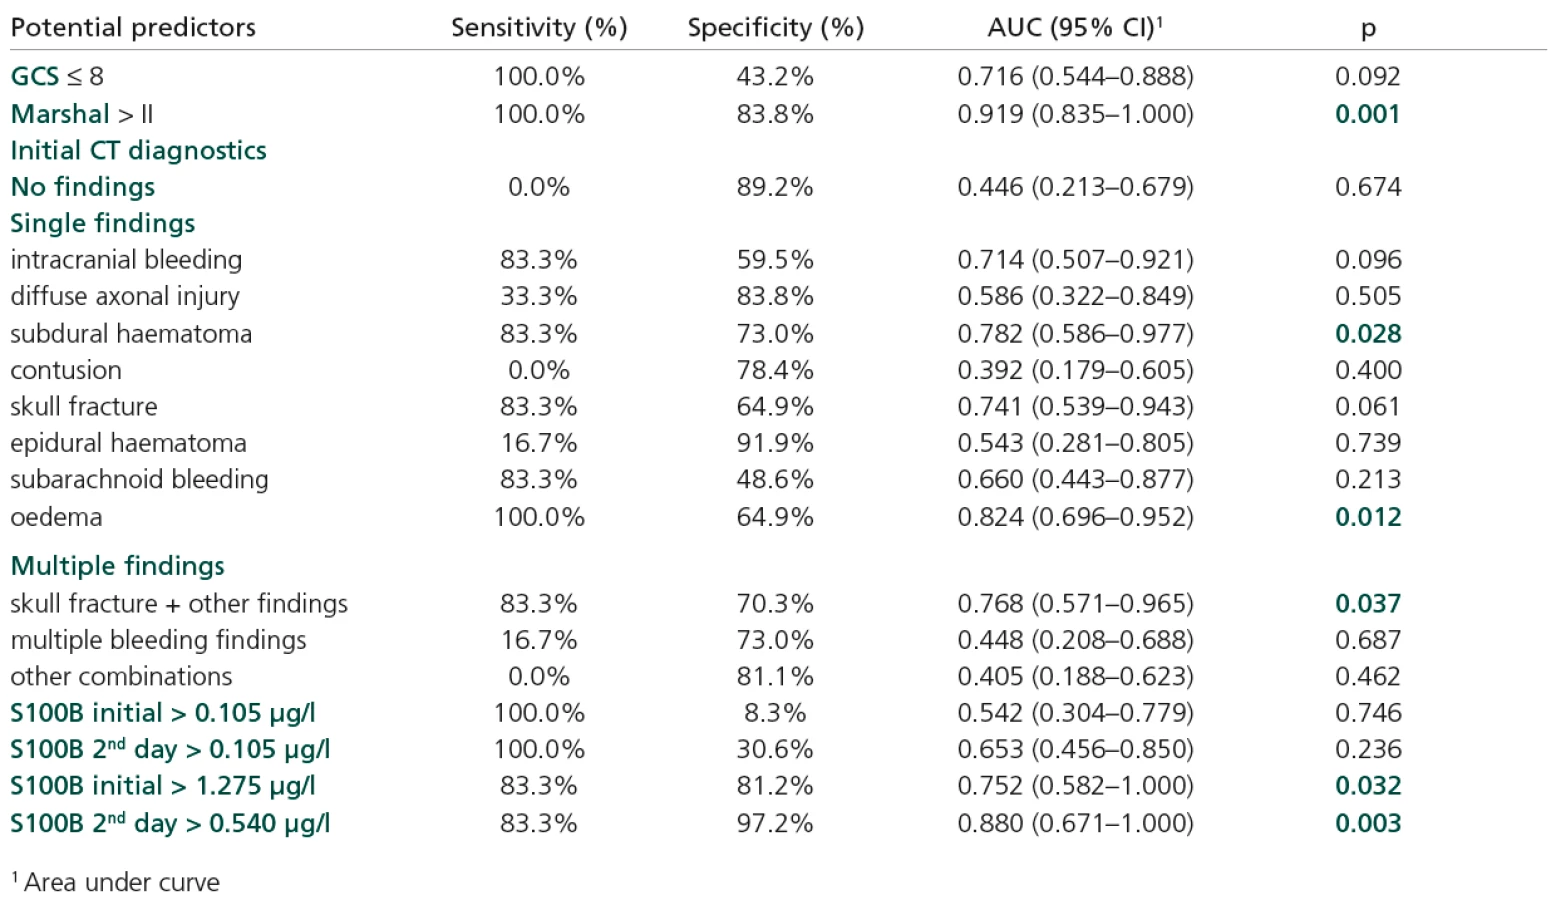
The following parameters were confirmed as significant predictors of GOS = 1:Marshall classification s. > II (AUC = 0.919; p = 0.001), subdural haematoma (AUC == 0.782; p = 0.028), oedema (AUC = 0.824; p = 0.012), skull fracture if combined with some other type of injury (AUC = 0.768; p = 0.037).
Discussion
GCS scores and cranial CT are the contemporary standards for considering severity and visualizing brain damage after TBI [10]. Despite the information from clinical and radiological examinations, estimating prognosis of TBI patients remains unmanageable in some instances.
The aims of this study were to investigate correlations between initial levels of serum S100B protein and mortality and computerized tomography (CT) findings, as well as to establish whether there is an association between S100B and Glasgow outcome scale (GOS) after six months. We anticipated that the initial biomarker concentrations would represent the severity of the primary injury and the accompanying immediate cell death. Peak concentration may, however, represent ongoing cell death occurring as part of secondary injury. We might expect the severity of secondary brain injury to have a stronger relationship with outcome than primary injury.
The use of serum biomarkers to assist in the prediction of outcome after TBI of all severities is an area of active study in adults. The paediatric literature is far less extensive. A study by Spinella et al [11] evaluated 27 children with TBI of varying severities, measured a single S100B concentration as soon as possible after injury and assessed outcome by dichotomized paediatric cerebral performance category (PCPC), a six point scale similar to GOS. In this study, there was a significant difference in S100B concentrations between subjects with good and poor outcomes six months post‑injury, although there were no subjects with mild or moderate TBI with poor outcome. Beers et al [12] measured serial serum concentrations of neuron‑specific enolase (NSE), S100B and myelin basic protein (MBP) in children with acute TBI. Outcome was assessed by GOS, Vineland adaptive behaviour scale (VABS) and an intelligence quotient (IQ) measurement. Student’s t‑tests, analysis of covariance, and nonparametric tests assessed between‑group differences for GOS, IQ and biomarkers. For all biomarkers and time points, higher biomarker concentrations were associated with worse outcomes. Our findings show that S100B levels significantly decrease in a group of patients with final GOS > 1. This decrease started in the second day of hospitalization and continued for the whole follow‑up period of six days. On the other hand, the cohort with GOS value = 1 did not exhibit a significant decrease in S100B values. Compared to adults, Lavička et al [13] demonstrated a rapid decrease in serum levels in the first 6–12 hours after admission in patients with good outcome, Vajtr et al [14] recorded increased S100B serum levels in patients who died.
Ingebrigtsen et al [15] found a correlation between serum S100B and post‑concussion symptoms in 50 patients with minor head injury and normal CT scan. The same authors reported increased serum levels in 4 of 24 patients with minor head injury and normal CT scans where magnetic resonance imaging revealed contusions in two cases [15]. In severe head injury, they observed increased S100B values in all cases; however, there are no data available on the diagnostic and prognostic value of these observations. Data in children are not available in these terms. In our study, we compared S100 values, different outcome groups at six months and the categories of Marshall classification of initial CT findings. This classification was developed to allow more accurate predictive statements at the time of initial patient evaluation regarding the likelihood of a fatal or nonfatal outcome. This is widely accepted as a classification that facilitates grading of injury severity and improves outcome prediction. Comparable to the findings in the original study [8], we were able to demonstrate a statistically significant relationship between a group of patients with GOS = 1 and Marshall classification score > II (no patient with GOS = 1 had Marshall score I or II), a statistically significant relationship between a group of patients with GOS = 1 and some type of injury diagnosed using CT examination: intracranial bleeding, subdural haematoma, skull fracture, subarachnoid bleeding, oedema, and multiple CT findings, namely skull fracture in combination with some other injury type. Levels of S100B were increased in patients with some specific types of injury, namely intracranial bleeding, subdural haematoma and oedema. On the other hand, S100B initial value and S100B second‑day are not significantly related to Marshall classification score. This may indicate, that serum S‑100B protein adds diagnostic information.
The diagnostic accuracy of a biomarker is a measure of its ability to accurately identify a disease state. The relationship between sensitivity and specificity may be determined using a receiver‑operating characteristic curve (ROC) [16]. An ROC curve is a graph of (sensitivity) versus (specificity) and the diagnostic accuracy of a biomarker may be quantified by using the area under the ROC curve (AUC). Good markers have AUC values between 0.8 and 0.9, and excellent markers have AUC values between 0.9 and 1.0. In our study, increased initial values of S100B also contributed to the risk prediction, but not at the cut‑off level > 0.105 µg/l.
In fact, this level seems to be too low to be an effective cut‑off point. In the first day of hospitalization it was exceeded by 100% of the risk patients (GOS = 1) but also by 91.7% of the other patients. Consequently, the initial level of S100B attained only very low specificity at this point. Objective ROC analysis proposed levels of > 1.28 µg/l on the first day of hospitalization and > 0.54 µg/l on the second.
Despite the wealth of data indicating the use of diagnostic and prognostic biomarkers for traumatic brain injury, there are still many outstanding issues in this area of research, especially in paediatric patients.
Conclusion
The level of S100B was confirmed as a clinically valuable indicator of the severity of injury and was proposed as an effective predictor of risk outcome (GOS = 1). The commonly recommended cut‑off level of > 0.105 µg/l appears to be too low in this study. Alternative cut‑off levels for the first and second day of hospitalization were proposed and verified in ROC analysis (both with sensitivity and specificity > 80%).
S100B values reveal significant time‑related dynamics; they decreased significantly in the group of patients with GOS > 1. The most significant decrease and at the same time the most specific differentiation of risk patients (GOS = 1) was observed in the second day of hospitalization.
Acknowledgment
We would like to thank the nurses of the Department of Anaesthesia and Intensive Care, University Children’s Hospital, Brno, for their efficient care and precise documentation.
Přijato k recenzi: 9. 10. 2009
Přijato do tisku: 23. 11. 2009
MUDr. Jiří Žurek
Klinika dětské anesteziologie a resuscitace LF MU a FN Brno
Černopolní 9
625 00 Brno
e-mail: jzurek@fnbrno.cz
Sources
1. Haslam RHA. Textbook of Pediatrics. 15th ed. Philadelphia: WB Saunders 1996.
2. Lescohier I, DiScala C. Blunt trauma in children: causes and outcomes of head versus extracranial injury. Pediatrics 1993; 91(4): 721–725.
3. Shore PM, Thomas NJ, Clark RS, Adelson PD, Wisniewski SR, Janesko KL et al. Continuous versus intermittent cerebrospinal fluid drainage after severe traumatic brain injury in children: effect on biochemical markers. J Neurotrauma 2004; 21(9): 1113–1122.
4. Hachitanda Y, Nakagawara A, Nagoshi M, Tsuneyoshi M. Prognostic value of N‑myc oncogene amplification and S‑100 protein positivity in children with neuroblastic tumors. Acta Pathol Jpn 1992; 42(9): 639–644.
5. Donato R. S100: a multigenic family of calcium‑modulated proteins of the EF‑hand type with intracellular and extracellular functional roles. Int J Biochem Cell Biol 2001; 33(7): 637–668.
6. Schäfer BW, Heizmann CW. The S100 family of ER‑hand calcium binding proteins: functions and pathology. Trends Biochem Sci 1996; 21(4): 134–140.
7. Teasdale G, Jennett B . Assessment of coma and impaired consciousness. A practical scale. Lancet 1974; 2(7872): 81–84.
8. Marshall LF, Marshall SB, Klauber MR, van Berkum‑Clark M, Eisenberg HM, Jane JA et al. A new classification of head injury based on computerized tomography. J Neurosurg 1991; 75 (Suppl): S14–S20.
9. Jennett B, Bond M. Assessment of outcome after severe brain damage. Lancet 1975; 1(7905): 480–484.
10. Casmiro M, Maitan S, De Pasquale F, Cova V, Scarpa E, Vignatelli L. Cerebrospinal fluid and serum neuron‑specific enolase concentrations in a normal population. Eur J Neurol 2005; 12(5): 369–374.
11. Spinella PC, Dominguez T, Drott HR, Huh J, McCormick L, Rajendra A et al. S‑100beta protein‑serum levels in healthy children and its association with outcome in pediatric traumatic brain injury. Crit Care Med 2003; 31(3): 939–945.
12. Beers SR, Berger RP, Adelson PD. Neurocognitive outcome and serum biomarkers in inflicted versus non‑inflicted traumatic brain injury in young children. J Neurotrauma 2007; 24(1): 97–105.
13. Lavička P, Pikner R, Kormunda S, Topolčan O, Bosman R, Chytra I et al. Význam stanovení S100B proteinu u pacientů s izolovaným poraněním hlavy. Cesk Slov Neurol N 2007; 70/103(5): 521–526.
14. Vajtr D, Průša R, Kukačka J, Houšťava L, Šámal F,Pachl J et al. Dynamika vývoje GCS, hladiny NSE a S100B v séru a morfologie expanzní kontuze u pacientů s poraněním hlavy. Cesk Slov Neurol N 2007; 70/103(5): 515–520.
15. Ingebrigtsen T, Romner B, Kongstad P, Langbakk B. Increased serum concentrations of protein S‑100 after minor head injury: a biochemical serum marker with prognostic value? J Neurol Neurosurg Psychiatry 1995; 59(1): 103–104.
16. Zweig MH, Campbell G. Receiver‑operating characteristic (ROC) plots: a fundamental evaluation tool in clinical medicine. Clin Chem 1993; 39(4): 561–577.
Labels
Paediatric neurology Neurosurgery NeurologyArticle was published in
Czech and Slovak Neurology and Neurosurgery

2010 Issue 1
Most read in this issue
- Sco2 Protein Deficiency-Based Mitochondrial Encephalomyopathy with the SMA‑like Picture of Neurogenic Muscle Atrophy – Case Reports
- Olfactory Testing in Neurological Diseases using Odourized Markers Test
- Congenital Myasthenic Syndromes – Case Reports
- Evoked Responses and Electromyography in Intraoperative Monitoring in Neurosurgery