
Evaluation of ice ball size as a function of freezing intensity through computed tomography scans during cryoablation procedures
Authors:
Angelica De Palma, Msc 1; Dr. Francesco Cortese 2; Dr. Giuseppe Di Giovanni 2; Dr. Fabrizio Acquafredda 2; Dr. Antonio Rosario Pisani 3; Prof. Riccardo Inchingolo 2,4
Authors‘ workplace:
Department of Mechanical and Aerospace Engineering – Biomedical Engineering, Politecnico di Torino, Italy
1; Interventional Radiology Unit, General Regional Hospital “F. Miulli”, Acquaviva delle Fonti, Italy
2; Nuclear Medicine Unit, Interdisciplinary Department of Medicine, University of Bari, Italy
3; Department of Medicine and Surgery, LUM University, Casamassima, Italy
4
Published in:
Klin Onkol 2026; 39(4): 276-286
Category:
Original Articles
doi:
https://doi.org/10.48095/ccko2026276
Overview
Background: Cryoablation is a specific minimally invasive thermal ablation technique that destroys tumor targets using low temperatures, freezing the pathological tissue and forming an “ice ball” around it. The aim of this study is to analyze how the reduction in freezing intensity during a cryoablation procedure affects the size of the ice ball. Materials and Methods: The experimentation was conducted on room-temperature ultrasound gel, using the ICEfx™ cryoablation system with IceSphere™ needles in single and multiple configurations (double, triple, and quadruple). Each configuration was studied using a freezing intensity of 100%, 70%, 50%, and 20%, with a single 10-minute freezing cycle. CT scans of the gel cubes were performed at the end of each freezing cycle to measure the dimensions of the individual ice balls. Results: Results show that the reduction in freezing intensity affects the size of the ice balls in a nonlinear but exponentially decreasing manner. Furthermore, the calculation of the decrement factors for each dimension, for every configuration and intensity level, highlighted that the width and depth of the ice ball are the most reduced dimensions, while the height values undergo minimal variation. Conclusion: This study provides the operator with a practical guide for customizing and optimizing in vivo cryoablation. This enables careful selection of the best configuration and freezing intensity to ensure the exclusion of adjacent sensitive anatomical structures that need to be preserved from freezing.
Keywords:
freezing – cryotherapy – imaging, three-dimensional – ice ball –size
Introduction
In oncology, surgery remains the gold standard treatment for tumors. However, with the development of imaging techniques such as computed tomography (CT), ultrasonography, and magnetic resonance imaging, less invasive therapies have increasingly gained ground. One of these is image-guided ablation, either thermal or non-thermal, which allows for the destruction of tumor targets. This study focuses on cryoablation, a specific type of thermal ablation.
Cryoablation can be performed with curative, debulking, or palliative intent. It uses low temperatures to freeze and destroy the tumor mass, reduce the lesion’s size, and provide an analgesic effect.
Thanks to the ability to choose the type and number of needles as well as the freezing intensity, the treatment can be tailored to the size and morphology of the lesion to be destroyed, aiming to spare the surrounding healthy tissues. Currently, the choice of freezing intensity is left to the operator, who may decide to use a lower power setting in order to reduce the ablation area, for example when the target is very close to delicate, preservable anatomical structures.
Cryoablation
Definition of cryoablation
Cryoablation or cryotherapy, refers to the destruction of pathological tissues through freezing [1].
This type of ablation is performed percutaneously under radiological guidance. The frozen zone has a temperature of 0 °C at its perimeter, while the lethal temperature is found within 5 mm inside the margins and can range between –20 °C and –50 °C [2].
Cryotherapy is carried out in cycles divided into phases – the first is a freezing phase, followed by a thawing phase. The tissue is initially cooled rapidly, and then, during the second phase, it gradually returns to its original temperature through reverse osmosis. The tissue damage caused by cryoablation results from both phases of the cycle [3].
Typically, two freezing cycles are applied, separated by a single thawing cycle.
A cryoprobe (with a low-pressure lumen) and a cryogenic unit are used. When high-pressure gas flows into the cryoprobe, it expands, resulting in a drop in temperature that enables the formation of the ice ball (representing the frozen area of pathological tissue) outside the cryogenic probe [4].
Currently, cryotherapy systems utilize the Joule-Thomson effect, which describes the ability of a gas to extract thermal energy from the surrounding area during its rapid expansion [5].
Cryobiology and mechanisms of action
Cryotherapy involves localized freezing leading to a reduction in thermal energy within tissues, thereby inducing significant biological damage [3]. To ensure tumor necrosis, an effective dose was established at a temperature of –40 °C for at least 60 seconds [3,6,7].
Harmful effects of cryoablation primarily result from two mechanisms – cellular injury and vascular injury. The former occurs immediately and is caused by the formation of ice crystals that induce cellular stress. As a result of the freeze-thaw cycles, mitochondrial metabolic functions are altered, which in turn triggers an apoptotic cascade in the targeted cells [8]. In contrast, the vascular injury mechanism has a delayed effect and arises from vascular stasis, which prevents blood from flowing to the tumor, thereby increasing cellular damage already inflicted [8,9].
Both types of injury are essential to ensure tumor destruction [10].
It is considered necessary to perform at least two freeze-thaw cycles, with rapid freezing (lasting at least 10 minutes) and slow thawing [11].
When to choose cryoablation
Cryoablation is indicated in situations where traditional surgery cannot be performed, such as in patients with multiple comorbidities, or as an alternative to surgery in cases of renal tumors smaller than 3 cm in size [12].
Aim
Given the lack of scientific evidence regarding the relationship between freezing intensity and ice ball size, the aim of this study is to analyze how the reduction of freezing intensity during a cryoablation procedure affects the size of the ablated area. This assessment is of fundamental importance as it provides the operator with practical guidance for optimizing in vivo treatment.
Materials and methods
The study was conducted using room--temperature ultrasound gel with IceSphereTM cryoablation needles (Galil Medical, Yokneam, Israel), utilized in single, double, triple, and quadruple configurations through the ICEfxTM cryoablation system (Boston Scientific). For each configuration, CT scans were acquired using a Philips Brilliance iCT 256 CT scanner with a dedicated phantom protocol. Images were reconstructed using a slice thickness of 2.5 mm and displayed with a window level of 60 HU and a window width of 360 HU.
Acquisitions were performed at the end of the first and only freezing cycle, i.e., after 10 minutes of probe activity and at freezing intensities of 100%, 70%, 50%, and 20%.
Specifically, for each configuration (single, double, triple, and quadruple), IceSphereTM cryoablation needles were inserted into cubes of room-temperature gel. After 10 minutes of probe activity, CT scans of the resulting ice balls were performed. The probes were then removed from the used gel cube and inserted into a new one prepared for ice ball formation at a different freezing intensity. For multiple configurations, cryoprobes were placed in parallel at an inter-probe distance of 1.5 cm using resorbable hemostatic gelatin sponges (Fig. 1).

This represents the maximum recommended distance between probes according to the guidelines for these specific cryoprobes, in order to assess whether synergy between multiple probes was maintained even at freezing intensities lower than 100% [13].
The next phase involved measuring, from the CT scans obtained for each configuration at the various freezing intensities, the three dimensions of each ice ball using the software “RadiAnt DICOM Viewer” (Fig. 2, 3). These data were used to create a table with the dimensions of the ice balls and graphs showing how ice ball size varied in relation to the reduced freezing intensity for each single or multiple probe configuration. Subsequently, for each configuration and freezing intensity, reduction factors for each dimension were calculated using an exponential model in the form D (p) = D (100%) * e–kp (1.1), where D (p) represents the dimension value at a freezing intensity percentage p, D (100%) is the dimension value at 100% freezing intensity, k is the decay rate that determines how quickly the value decreases with respect to the freezing intensity percentage, and p represents the freezing intensity percentage, where 1 corresponds to 100% and 0 corresponds to 0%. Thus, e–kp acts as a multiplier that reduces D (100%) as the freezing intensity p decreases.


Consequently, through the ratio RF = D (p) /D (100%) (1.2) the remaining fraction (RF) of the dimension relative to the reference value at 100% freezing intensity is obtained. If the ratio equals 1, it indicates that the dimension has not changed; if it is < 1, it means the dimension has decreased; whereas if it is > 1, the dimension has increased.
To determine the percentage decrease of each dimension, the ratio RF (1.2) is subtracted from 1 and the result is multiplied by 100.
%decrease = [1−RF] * 100 = [1 − D (p) //D (100%) ] * 100 (1.3).
Results
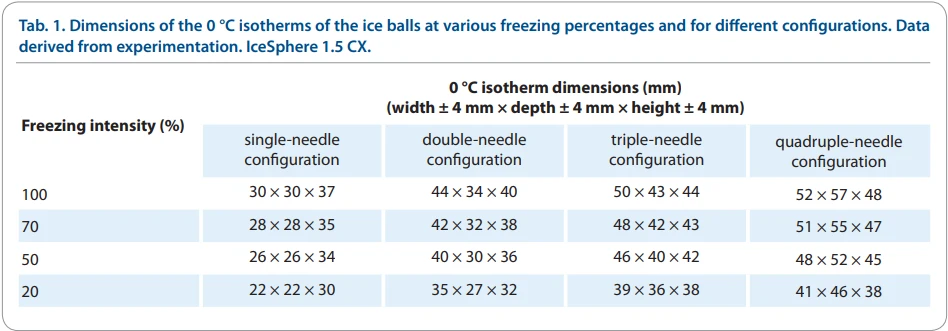
From the analysis of the CT scans performed during the tests, it was possible to determine the dimensions of the ice balls for various configurations, both single and multiple, and at different freezing intensity percentages. Results are presented in Tab. 1, and for their interpretation, refer to Fig. 4, which schematically illustrates the three dimensions of a generic ice ball.
Data obtained from the analysis of the CT scans of the gel cubes with their respective ice balls allowed for the creation of graphs (Fig. 5 for the single probe configuration and Fig. 6–8 for the multiple needles configuration) that highlight the variation in the three dimensions of the ice ball as a function of different freezing intensity percentages.


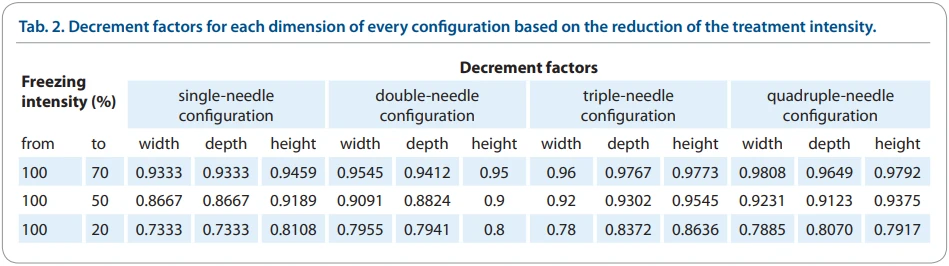
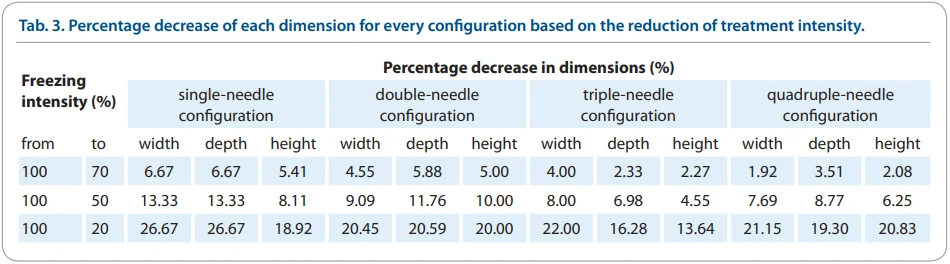
Furthermore, decrement factors are reported in Tab. 2. The percentage decrease obtained using formula 1.3 for the three dimensions of the ice balls at various levels of reduced freezing intensity is specified in Tab. 3.
Discussion
From the data published by Boston Scientific (Fig. 9), it is known that at 37 °C, a single IceSphereTM probe creates an ice ball that at 0 °C (the outermost isotherm, visible margin in the CT scans) is 31 mm wide and 36 mm long. Instead, the dimensions obtained with multiple configurations vary depending on the number of cryoprobes used synergistically.
![Graphical representation by the authors based on data reported by Boston Scientific. Dimensions of the ice balls generated by the IceSphere™ needle in single or multiple configuration; data obtained in gel at 37 °C [14].](https://pl-master.mdcdn.cz/media/cache/media_object_image_large/media/image/20f59b786d081653b1ea168f77110e2d.png)
At room temperature, however, Boston Scientific reports larger dimensions – with a single IceSphereTM needle, the resulting ice ball forms an isotherm visible in the CT scans (i.e., at 0 °C) measuring 39 × 44 mm (at –20 ºC it measures 25 × 31 mm, and at –40 ºC it is 15 × 24 mm) [15]. This difference in size can mainly be attributed to different temperatures, which in the second case, allow for greater cooling and less heat dissipation at room temperature.
Both the measurement at 37 °C and those at room temperature were obtained through experiments on gel, resp. at 37 °C and room temperature, after two 10-minute freezing cycles using 100% freezing intensity, separated by a 5-minute passive thawing cycle [13].
It is important to note that the dimensions refer to two different perspectives – the single configuration dimensions refer to a lateral view, while the dimensions for multiple configurations refer to a top-down view. Therefore, for the single probe, the first dimension refers to the width of the ice ball (the dimension perpendicular to the longitudinal axis of the cryoprobe), and the second refers to the height of the ice ball, which is the extension along the axis of the active part of the probe. The third dimension, which is not measurable when viewed from above, is considered equal to the width. For multiple configurations, however, the dimensions in Fig. 9 refer to the isotherms seen from above. Therefore, the first dimension represents the width of the ice ball, perpendicular to the longitudinal axis of the probe, while the second dimension represents the depth. The height of the ice balls created by multiple configurations is considered equal to that of the respective single configuration.
By comparing the dimensions of the 0 °C isotherms of the ice balls created with the IceSphereTM probe for the various configurations at 100% freezing intensity in Fig. 9 with those measured in this experiment, as shown in Tab. 1, it is possible to observe that the proportions are maintained in all three dimensions. However, it should be noted that the measurements in Tab. 1 refer to ice balls generated in gel at room temperature, whereas the reference measurements in Fig. 9 were obtained using gel at 37 °C.
Instead, taking as a reference the dimensions reported above for the ice ball resulting from a single configuration with the IceSphere™ needle at room temperature, it is possible to observe that the dimensions obtained from this experimental study differ from the reference ones by a few millimeters. This discrepancy is justified by the fact that the reference dimensions result from a double freezing cycle and are therefore larger than those obtained at the end of the first cycle (as in the case of the measurements in Tab. 1). Moreover, for a more accurate comparison, it should be noted that the measurements reported in Tab. 1, Fig. 9 and those referring to the ice ball dimensions at room temperature (39 × 44 mm) are subject to an uncertainty of ± 3–4 mm.
What diverges from Boston Scientific’s guidelines in this case, however, is the height of the ice balls – i.e., the distance measured along the longitudinal axis of the IceSphereTM cryoprobe – which, in the case of multiple configurations, does not match that of the corresponding single configuration. According to the dimensions obtained from the experimental investigation presented in this scientific article, it can be seen that as the number of simultaneously used probes increases, the height of the ice balls also increases. This may be due to several factors, such as the synergistic effect between multiple cryoprobes leading to locally enhanced freezing, or differences in the properties of the gel used.
An analysis of multiple-needle configurations shows that millimetric variations in ice ball isotherms across different freezing intensities are of limited clinical relevance. Consequently, a single-needle configuration is commonly considered in clinical practice when treatment de-escalation is desired.
It is also important to note that as freezing intensity decreases, dimensions of the ice balls are reduced accordingly.
By conducting the test using a single probe at maximum freezing intensity, it was possible to confirm the validity and reliability of the data presented in this study, through a direct comparison between the ice ball dimensions obtained in this experimentation and those reported by Boston Scientific.
As for the graphs representing the variation in the three dimensions of the ice ball as a function of different freezing intensity percentages, the graph for the single configuration shown in Fig. 5 displays a comparison between the curves representing how each dimension changes with varying freezing intensities. It can be observed that the dimensional values decrease as freezing intensity is reduced. Furthermore, as previously explained, two out of the three dimensions share the same values – namely, width and depth – and thus their curves overlap.
For multiple configurations (Fig. 6–8), three distinct curves can be seen, each showing a downward trend, indicating that the dimensions decrease as the freezing intensity decreases. It is noticeable that the width and depth curves follow a similar pattern, and they are the dimensions that shrink the most, in contrast to height, which exhibits a less pronounced variation.
Overall, the data show minimal dimensional changes between 100 and 70% freezing intensity, as well as between 70 and 50%. However, a more evident reduction appears starting from 50% down to lower freezing intensities.
Fig. 10 presents a schematic representation (1 : 2 scale) of the ice balls (0 °C isotherms) generated for each needle configuration at different freezing intensities throughout the experimental study.

To interpret the decrement factors in Tab. 2, take for example the widths of the ice balls from the single configuration at 100% and 70% freezing intensity. According to Tab. 1, the two values are 30 mm and 28 mm, resp. Therefore, by calculating the ratio between the dimension at 70% and the one at 100%, the following is obtained: RF = D (p) /D (100%) = = 28 mm/30 mm = 0.9333.
This factor, found in the first row (indicating a reduction from 100% to 70%) and the first column (representing the specific dimension under the corresponding configuration) of Tab. 2, indicates that the dimension of the ice ball at 70% freezing intensity is approximately 93.33% of its dimension at 100% freezing intensity.
In other words, the dimension has been reduced by 6.67% compared to its initial value – a value calculated using formula 1.3. Therefore, in the example considered, we have: %decrease = [1 − – 28 mm/30 mm] * 100 = 6.67%.
All decrement factors listed in Tab. 2 can be interpreted in this way. Meanwhile, the percentage decreases as calculated using formula 1.3, and is experienced by the three dimensions of the ice balls at the various freezing intensity reductions, which are shownin Tab. 3.
For each configuration, the smallest values of decrement factors (Tab. 2) correspond to the reduction from 100% to 20% (last row of Tab. 2). This highlights what was previously stated, namely that minimal dimensional changes are observed between 100% and 70% freezing intensity (decrement factors close to one), as well as between 100% and 50%. Specifically, from Tab. 3 it is possible to observe that with a power reduction to 70%, among the various configurations, the width and depth decrease by 2–7%, while the height decreases by 2–5%. At 50% freezing intensity, the width decreases by 8–13%, the depth by 7–13%, and the height by 5–10%. Instead, a more evident reduction is observed starting from a 50% power reduction toward greater reductions, up to a 20% reduction where the synergy among the various needles in the multiple configurations is still ensured, and a single ice ball is generated for each configuration. At this level of power reduction, the dimensions undergo greater decreases – the width decreases by 21–27%, the depth by 16–27%, and the height by 14–21%.
The percentage range provided for each dimension encompasses the value reductions that the dimensions undergo in different configurations (single or multiple). Therefore, it is possible to confirm what was previously described in relation to the graphs in Fig. 5–8, stating that the dimension that undergoes the least variation is the height (the dimension parallel to the longitudinal axis of the needle), while width and depth are the dimensions that show the most significant reductions in value as the treatment is weakened.
Furthermore, both from the non-linear graphs in Fig. 3–6, as well as from Tab. 3, it is evident that there is no direct proportionality between the reduction in freezing intensity and the decrease in dimensions. In fact, through Tab. 3, it can be seen that at 50% freezing intensity, there is not a 50% decrease in size, but rather a significantly smaller reduction.
Although all configurations have been analyzed, it is important to specify that, in clinical practice, the configuration for which it is most necessary to understand the variation in size as a function of freezing intensity is the single configuration. In fact, when multiple configurations are used to cover a larger tumor area, but there is a need to reduce treatment intensity – because, for example, there may be a body structure that needs to be preserved near the tumor – only one of the needles typically has its freezing intensity reduced. Specifically, the needle closest to the area to be avoided in the ablation is depowered. This is achievable thanks to the ability to insert each needle into one of the four independent channels of the ICEfxTM cryoablation system.
However, precise procedure planning, needle positioning, and hydro - or pneumo-dissection still remain as the primary cornerstones of safety.
Limitations and future perspectives
In this study, single and multiple configurations of the IceSphereTM probe were evaluated through an experiment on gel at ambient temperature. Some limitations, such as studying only one type of probe or the temperature at which the study was conducted, open the door to future prospects that could help operators fully utilize all existing types of cryoprobes, with the aim of providing patients with the best possible treatment.
For example, a more realistic simulation of clinical conditions could be achieved by using animal organs, such as the liver. Indeed, although the gel model is commonly used for this type of experimentation, its properties do not reflect the complexity of human biological tissues. Clearly, it is essential that such experiments be conducted in compliance with current ethical regulations, resorting to alternative models whenever possible.
Furthermore, a study at 37 °C could better simulate the patient’s body temperature, and a comprehensive view of the ice ball dimensions achievable with all types of cryoprobes would ensure greater safety for the operator and optimal treatment for the patient.
Conclusion
This study considered cryoablation, a specific technique of thermal ablation that is becoming increasingly relevant in oncology for the minimally invasive treatment of tumors.
In particular, the experiment, conducted on ultrasound gel at room temperature, allowed for the monitoring and measurement of the ice ball dimensions obtained with the ICEfxTM cryoablation system, which offers the possibility to examine different freezing intensities and configurations of IceSphereTM cryoablation needles.
The results, obtained after a 10-minute freezing cycle, show how reduction in freezing intensity non-linearly affects the ice ball dimensions, with an exponentially decreasing trend. By creating a table of decrement factors for each dimension for every configuration and freezing intensity, the aim was to provide the treatment staff with a practical guide for cryoablation customization. This allows for careful selection of the best configuration and freezing intensity to treat the patient, ensuring that the entire tumor area is frozen while minimizing the risk of injury to adjacent sensitive anatomical structures that need to be preserved.
In conclusion, this study could represent a significant step forward in treatment personalization, enhancing its clinical effectiveness and reducing the risk of complications.
Funding statements
This research did not receive any specific grant from funding agencies in the public, commercial, or not-for-profit sectors.
Sources
1. Tatli S, Acar M, Tuncali K et al. Percutaneous cryoablation techniques and clinical applications. Diagn Interv Radiol 2010; 16 (1): 90–95. doi: 10.4261/1305-3825.DIR.1922-08.0.
2. Bouley DM, Daniel B, Pauly KB et al. Correlation of contrast-enhanced MR images with the histopathology of minimally invasive thermal and cryoablation cancer treatments in normal dog prostates. Proc SPIE Int Soc Opt Eng 2007; 6440 : 644006. doi: 10.1117/12.701049.
3. Basic science: A) principles and mechanisms of cell damage induced by cryotherapy. Pisa (IT): University of Pisa, Department of Information Engineering. [online]. Available from: http: //159.213.35.71/scienza.html.
4. Schena E, Tosi D, Saccomandi P et al. Fiber optic sensors for temperature monitoring during thermal treatments: an overview. Sensors (Basel) 2016; 16 (7): 1144–1154.
5. Mahnken AH, König AM, Figiel JH. Current technique and application of percutaneous cryotherapy. Rofo 2018; 190 (9): 836–846. doi: 10.1055/a-0598-5134.
6. Cooper IS. Cryobiology as viewed by the surgeon.Cryobiology 1964; 51 : 44–51. doi: 10.1016/0011-2240 (64) 90019-7.
7. Cooper IS. Cryogenic surgery for cancer. Fed Proc 1965; 24 (Suppl): S237–S240.
8. Kwak K, Yu B, Lewandowski RJ et al. Recent progress in cryoablation cancer therapy and nanoparticles mediated cryoablation. Theranostics 2022; 12 (5): 2175–2204. doi: 10.7150/thno.67530.
9. Gage AA, Baust J. Mechanisms of tissue injury in cryosurgery. Cryobiology 1998; 37 (3): 171–186. doi: 10.1006/cryo.1998.2115.
10. Theodorescu D. Cancer cryotherapy: evolution and biology. Rev Urol 2004; 6 (Suppl 4): S9–S19.
11. Cranwell WC, Sinclair R. Optimising cryosurgery technique. Aust Fam Physician 2017; 46 (5): 270–274.
12. Breen DJ, King AJ, Patel N et al. Image-guided cryoablation for sporadic renal cell carcinoma: three - and 5-year outcomes in 220 patients with biopsy-proven renal cell carcinoma. Radiology 2018; 289 (2): 554–561. doi: 10.1148/radiol.2018180249.
13. Boston Scientific. CX needles isotherm guide. [online]. Available from: https: //www.bostonscientific.com/content/dam/bostonscientific/pi/portfolio-group/cryoablation/visualice/pi-754604-ac-cx-needle-isotherm-guide.pdf.
14. Boston Scientific. Cryoablation treatment planning. [online]. Available from: https: //www.bostonscientific.com/content/dam/bostonscientific/pi/portfolio-group/pdf-documents/PI-814202-AB%20Cryo-ablation%20Treatment%20Planning%20-%20FINAL%20CORRECTED.pdf.
15. Boston Scientific. Cryoablation product catalogue.[online]. Available from: https: //www.bostonscientific.com/content/dam/bostonscientific/pi/portfolio-group/pdf-documents/PI-929802-AA%20Cryoablation%20Product%20Catalogue-FINAL.pdf.
Labels
Paediatric clinical oncology Surgery Clinical oncologyArticle was published in
Clinical Oncology

2026 Issue 4
Most read in this issue
- IgG4-related disease – treatment with anti-CD20, anti-CD19 antibodies, and other new drugs
- Treatment of Erdheim-Chester disease from the perspective in 2026
- FGFR2 fusion as the key to targeted therapy – a case report with a diagnostic turning point
- HPV infection and its significance in the development and prevention of cervical cancer