-
Články
- Vzdělávání
- Časopisy
Top články
Nové číslo
- Témata
- Kongresy
- Videa
- Podcasty
Nové podcasty
Reklama- Kariéra
Doporučené pozice
Reklama- Praxe
Immune-related genetic enrichment in frontotemporal dementia: An analysis of genome-wide association studies
Rahul Desikan and colleagues use summary data from genome-wide association studies to investigate genetic overlap between frontotemporal dementia and a several immune-mediated diseases, and identify microglia and inflammation-associated genes that may play a role in FTD pathogenesis.
Published in the journal: . PLoS Med 15(1): e32767. doi:10.1371/journal.pmed.1002487
Category: Research Article
doi: https://doi.org/10.1371/journal.pmed.1002487Summary
Rahul Desikan and colleagues use summary data from genome-wide association studies to investigate genetic overlap between frontotemporal dementia and a several immune-mediated diseases, and identify microglia and inflammation-associated genes that may play a role in FTD pathogenesis.
Introduction
Frontotemporal dementia (FTD) is a fatal neurodegenerative disorder and the leading cause of dementia among individuals younger than 65 years of age [1]. Given rapid disease progression and the absence of disease-modifying therapies, there is an urgent need to better understand FTD pathobiology to accelerate development of novel preventive and therapeutic strategies.
Converging molecular, cellular, genetic, and clinical evidence suggests that neuroinflammation plays a role in FTD pathogenesis. Complement factors and activated microglia, key components of inflammation, have been established as histopathologic features in brains of patients [2] and in mouse models of FTD [3,4]. Genome-wide association studies (GWASs) have shown that single nucleotide polymorphisms (SNPs) within the immune-regulating human leukocyte antigen (HLA) region on Chromosome (Chr) 6 are associated with elevated FTD risk [5]. Importantly, there is increased prevalence of immune-mediated diseases among patients with FTD [6,7]. Together, these findings suggest that immune-related mechanisms may contribute to and potentially drive FTD pathology.
Recent work in human molecular genetics has emphasized “pleiotropy,” where variations in a single gene can affect multiple, seemingly unrelated phenotypes [8]. In the present study, we systematically evaluated genetic pleiotropy between FTD and immune-mediated diseases. Using large neurodegenerative GWASs and recently developed tools to estimate polygenic pleiotropy, we sought to identify SNPs jointly associated with FTD-related disorders [9,10]—namely, FTD, corticobasal degeneration (CBD), progressive supranuclear palsy (PSP), and amyotrophic lateral sclerosis (ALS)—and 1 or more immune-mediated diseases including Crohn disease (CD), ulcerative colitis (UC), rheumatoid arthritis (RA), type 1 diabetes (T1D), celiac disease (CeD), and psoriasis (PSOR).
Methods
Participant samples
We conducted a meta-analysis of summary data obtained from published data. More specifically, we evaluated complete GWAS results in the form of summary statistics (p-values and odds ratios) for FTD, CBD, PSP, and ALS and 6 immune-mediated diseases, including CD [11], UC [12], RA [13], T1D [14], CeD [15], and PSOR [16] (see Table 1). We obtained FTD GWAS summary statistic data from phase I of the International FTD-Genomics Consortium (IFGC), which consisted of 2,154 clinical FTD cases and 4,308 controls with genotyped and imputed data at 6,026,384 SNPs (Table 1; for additional details, see [5]). The FTD dataset included multiple clinically diagnosed FTD subtypes: behavioral variant (bvFTD), semantic dementia (sdFTD), primary nonfluent progressive aphasia (pnfaFTD), and FTD overlapping with motor neuron disease (mndFTD). These FTD cases and controls were recruited from 44 international research groups and diagnosed according to the Neary criteria [17]. The institutional review boards of all participating institutions approved the procedures for all IFGC sub-studies. Written informed consent was obtained from all participants or surrogates. We obtained CBD GWAS summary statistic data from 152 CBD cases and 3,311 controls at 533,898 SNPs (Table 1; for additional details, see [18]). The CBD cases were collected from 8 institutions, and controls were recruited from the Children’s Hospital of Philadelphia. CBD was neuropathologically diagnosed using the National Institutes of Health Office of Rare Diseases Research criteria [19]. The institutional review boards of all participating institutions approved the procedures for CBD GWAS data. Written informed consent was obtained from all participants or surrogates. We obtained PSP GWAS summary statistic data (stage 1) from the National Institute on Aging Genetics of Alzheimer’s Disease Data Storage Site (NIAGADS, https://www.niagads.org) for 1,114 individuals with autopsy-confirmed PSP and 3,247 controls at 531,451 SNPs (Table 1; for additional details, see [20]). The institutional review boards of all participating institutions approved the procedures for all NIAGADS sub-studies. Written informed consent was obtained from all participants or surrogates. We obtained ALS GWAS summary statistic data from 12,577 ALS cases and 23,475 controls at 18,741,501 SNPs (Table 1; for additional details, see [21]). The ALS GWAS summary statistics and sequenced variants are publicly available through the Project MinE Data Browser (http://databrowser.projectmine.com). The institutional review boards of all participating institutions approved the procedures for all ALS GWAS sub-studies. Written informed consent was obtained from all participants or surrogates.
Tab. 1. Summary data from all genome-wide association studies used in the current study. 
Genetic enrichment statistical analyses
The pleiotropic enrichment strategies implemented here were derived from previously published stratified false discovery rate (FDR) methods [22,23]. For given phenotypes A and B, pleiotropic “enrichment” between phenotype A and phenotype B exists if the proportion of SNPs or genes associated with phenotype A increases as a function of increased association with phenotype B. To assess for enrichment, we constructed fold enrichment plots of nominal −log10(p)-values for all FTD-related-disorder SNPs and for subsets of SNPs determined by the significance of their association with the 6 immune-mediated diseases. In fold enrichment plots, the presence of enrichment is reflected as an upward deflection of the curve for phenotype A with increasing strength of association with phenotype B. To assess for polygenic effects below the standard GWAS significance threshold, we focused the fold enrichment plots on SNPs with nominal −log10(p) < 7.3 (corresponding to p > 5 × 10⁻⁸). The enrichment seen can be directly interpreted in terms of the true discovery rate (1 − FDR).
To identify specific loci jointly involved with each of the 4 FTD-related disorders and the 6 immune-mediated diseases, we computed conjunction FDRs. The conjunction FDR is a test of association between 2 traits [22]. Briefly, the conjunction FDR, denoted by FDRtrait1& trait2, is defined as the posterior probability that a SNP is null for either trait or for both simultaneously, given that the p-values for both traits are as small, or smaller, than the observed p-values. Unlike the conditional FDR, which ranks disease/primary-phenotype-associated SNPs based on genetic “relatedness” with secondary phenotypes [24], the conjunction FDR minimizes the possibility/likelihood of a single phenotype driving the common association signal. The conjunction FDR therefore tends to be more conservative and specifically pinpoints pleiotropic loci shared between the traits/diseases of interest. We used an overall FDR threshold of <0.05, which means 5 expected false discoveries per 100 reported. To visualize the results of our conjunction FDR analysis, we constructed Manhattan plots to illustrate the genomic location of the pleiotropic loci. We ranked all SNPs based on the conjunction FDR and removed SNPs in linkage disequilibrium (r2 > 0.2) with any higher ranked SNP. Key aspects and detailed information on fold enrichment plots, Manhattan plots, and conjunction FDRs can be found in prior reports [22,23,25,26].
Functional evaluation of shared risk loci
To assess whether SNPs that are shared between FTD and immune-mediated disease modify gene expression, we identified cis-expression quantitative trait loci (cis-eQTLs, defined as variants within 1 Mb of a gene’s transcription start site) associated with shared FTD–immune SNPs and measured their regional brain expression in a publicly available dataset of normal control brains (UK Brain Expression Consortium; http://braineac.org/) [27]. We also evaluated cis-eQTLs using a blood-based dataset [28]. We applied an analysis of covariance (ANCOVA) to test for associations between genotypes and gene expression. We tested SNPs using an additive model.
Network-based functional association analyses
To evaluate potential protein and genetic interactions, co-expression, co-localization, and protein domain similarity for the functionally expressed (i.e., with significant cis-eQTLs) pleiotropic genes, we used GeneMANIA (http://genemania.org), an online web portal for bioinformatic assessment of gene networks [29]. In addition to visualizing the composite gene network, we also assessed the weights of individual components within the network [30].
Gene expression alterations in FTD brains
To determine whether functionally expressed (i.e., with significant cis-eQTLs) pleiotropic genes are differentially expressed in the brains of FTD patients, we analyzed the gene expression of pleiotropic genes. Postmortem expression data from the brains of 17 patients with frontotemporal lobar degeneration with ubiquitinated inclusions (FTD-U) (with and without progranulin [GRN] mutations) and 11 controls were obtained from a publically available dataset (Gene Expression Omnibus [GEO] dataset GSE13162; for additional details, see [31]). These data consist of global gene expression profiles from all histopathologically available regions from human FTD-U and control brains (frontal cortex, hippocampus, and cerebellum) analyzed on the Affymetrix U133A microarray platform. Given the small sample size of each individual region, we combined all 3 regions to maximize statistical power. Details about this dataset and analysis—including the human brain samples used, RNA extraction and hybridization methods, microarray quality control, and microarray data analysis—are provided in the original report [31].
Evaluation of cell classes within the brain
Using a publicly available RNA-sequencing transcriptome and splicing database [32], we ascertained whether the functionally expressed (i.e., with significant cis-eQTLs) pleiotropic genes were expressed by specific cell classes within the brain. The 8 cell types surveyed were neurons, fetal and mature astrocytes, oligodendrocyte precursor cells, newly formed oligodendrocytes, myelinating oligodendrocytes, microglia/macrophages (henceforth “microglia”), endothelial cells, and pericytes (for additional details, see [32]).
Results
Shared genetic risk between FTD and immune-mediated disease
Using progressively stringent p-value thresholds for FTD SNPs (i.e., increasing values of nominal −log10[p]), we observed genetic enrichment for FTD as a function of several immune-mediated diseases (Fig 1). More specifically, we found strong (up to 270-fold) genetic enrichment between FTD and RA, and comparable enrichment between FTD and UC, T1D, and CeD, with weaker enrichment between FTD and PSOR and CD.
Fig. 1. Fold enrichment plots of enrichment versus nominal −log10(p)-values (corrected for inflation) in frontotemporal dementia (FTD) below the standard genome-wide association study threshold of p < 5 × 10⁻⁸ as a function of significance of association with 6 immune-mediated diseases. 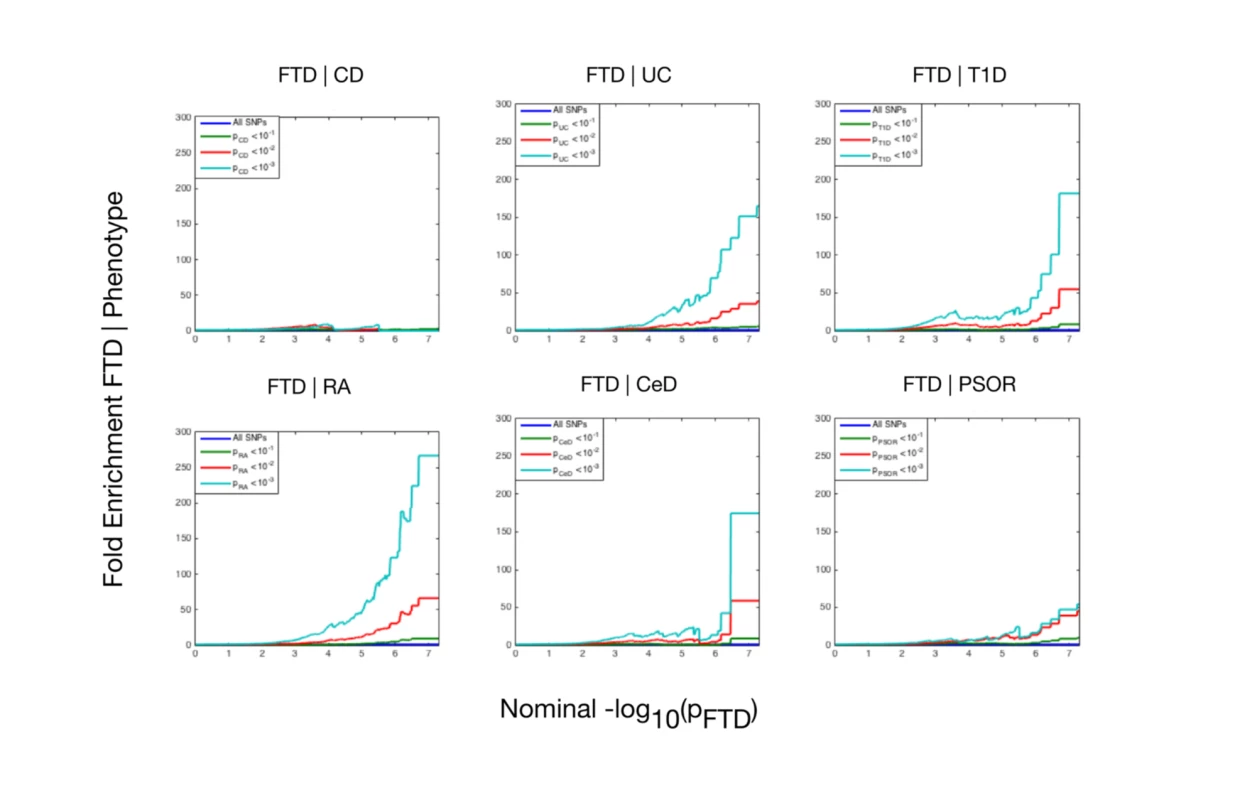
The 6 immune-mediated diseases are Crohn disease (CD), ulcerative colitis (UC), type 1 diabetes (T1D), rheumatoid arthritis (RA), celiac disease (CeD), and psoriasis (PSOR). The levels of −log10(p) > 0, −log10(p) > 1, and −log10(p) > 2 correspond to p < 1, p < 0.1, and p < 0.01, respectively. The dark blue line indicates all SNPs. At a conjunction FDR < 0.05, we identified 21 SNPs that were associated with both FTD and immune-mediated diseases (Fig 2; Table 2). Five of these SNPs demonstrated the opposite direction of allelic effect between FTD and the immune-mediated diseases (Table 2): (1) rs9261536, nearest gene = TRIM15; (2) rs3094138, nearest gene = TRIM26; (3) rs9268877, nearest gene = HLA-DRA; (4) rs10484561, nearest gene = HLA-DQB1; and (5) rs2269423, nearest gene = AGPAT1. Of the remaining 16, 2 SNPs showed strong linkage disequilibrium (LD), suggesting that they reflected the same signal: rs204991 and rs204989 (nearest gene: GPSM3; pairwise D′ = 1, r2 = 1). After excluding SNPs that demonstrated the opposite direction of allelic effect and SNPs that were in LD, we found that 8 of the remaining 15 identified loci mapped to the HLA region, suggesting that HLA markers were critical in driving our results. To test this hypothesis, we repeated our enrichment analysis after removing all SNPs in LD with r2 > 0.2 within 1 Mb of HLA variants (based on 1000 Genomes Project LD structure). After removing HLA SNPs, we saw considerable attenuation of genetic enrichment in FTD as a function of immune-mediated disease (Fig 3), suggesting that the observed overlap between immune-related diseases and FTD was largely driven by the HLA region. Further, to determine causal associations for FTD and the 6 immune-mediated diseases, we applied the recently developed summary-data-based Mendelian randomization (SMR; http://cnsgenomics.com/software/smr/) method. This approach is described in detail within the original report [33]. As shown in S1 Table, results from the SMR analysis have identified significant loci that are consistent with the main findings, which suggest that HLA markers on Chr 6 are critical in driving our pleiotropic results.
Fig. 2. “Conjunction” Manhattan plot of conjunction −log10(FDR) values for frontotemporal dementia (FTD) given 6 immune-mediated diseases. 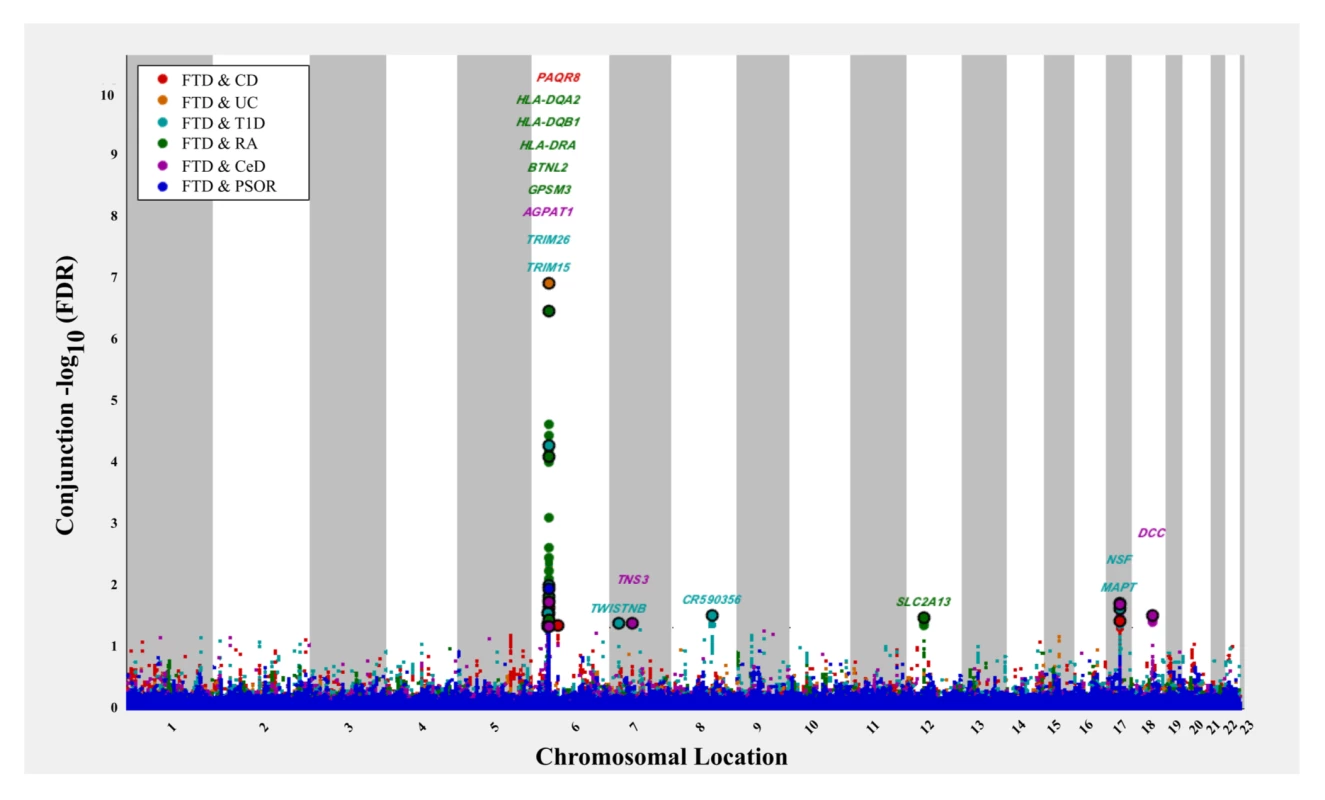
The 6 immune-related diseases were Crohn disease (CD; FTD|CD, red), ulcerative colitis (UC, FTD|UC, orange), type 1 diabetes (T1D, FTD|T1D, teal), rheumatoid arthritis (RA, FTD|RA, green), celiac disease (CeD, FTD|CeD, magenta), and psoriasis (PSOR, FTD|PSOR, blue). SNPs with conjunction −log10(FDR) > 1.3 (i.e., FDR < 0.05) are shown with large points. A black line around the large points indicates the most significant SNP in each linkage disequilibrium block, and this SNP was annotated with the closest gene, which is listed above the symbols in each locus. Fig. 3. Fold enrichment plots of enrichment (after removing all regions in linkage disequilibrium with HLA on Chromosome 6) versus nominal −log10(p)-values (corrected for inflation) in frontotemporal dementia (FTD) below the standard genome-wide association study threshold of p < 5 × 10⁻⁸ as a function of significance of association with 6 immune-mediated diseases. 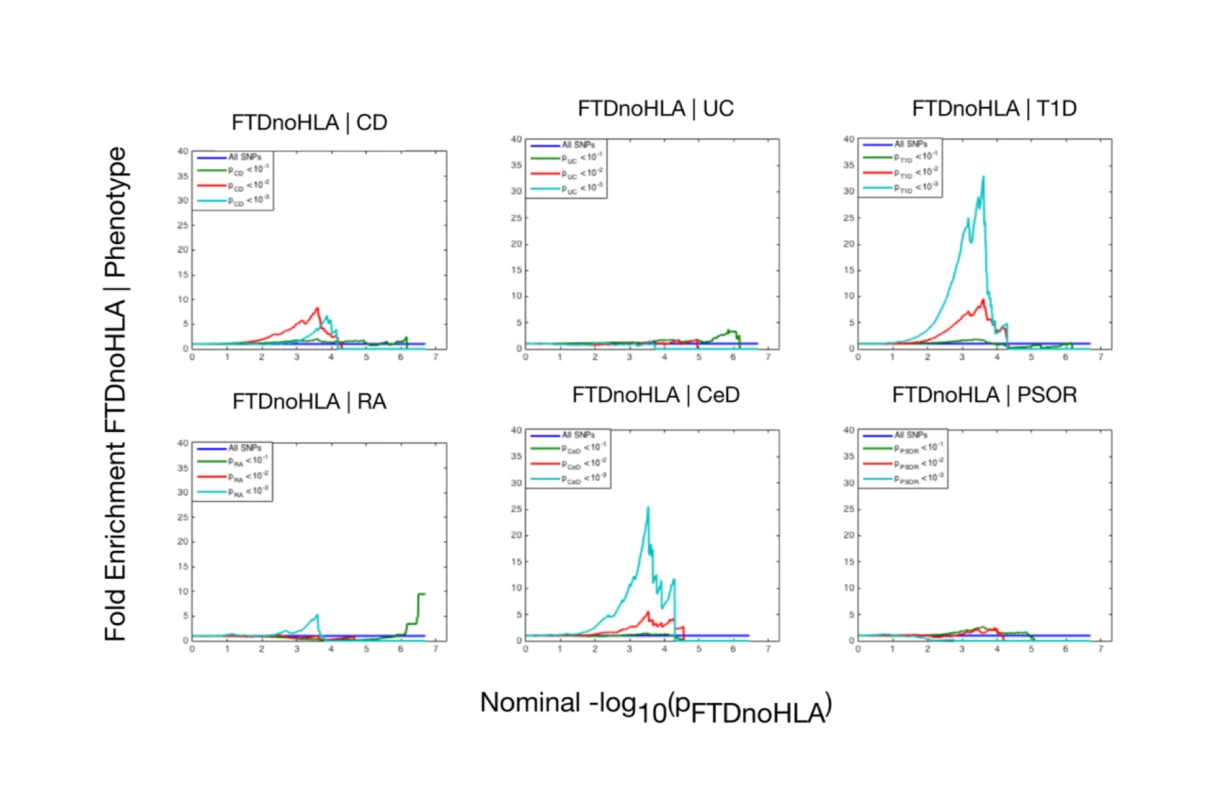
The 6 immune-mediated diseases were Crohn disease (CD), ulcerative colitis (UC), type 1 diabetes (T1D), rheumatoid arthritis (RA), celiac disease (CeD), and psoriasis (PSOR). The levels of −log10(p) > 0, −log10(p) > 1, and −log10(p) > 2 correspond to p < 1, p < 0.1, and p < 0.01, respectively. The dark blue line indicates all SNPs. Tab. 2. Overlapping loci between FTD and immune-mediated disease at a conjunction FDR < 0.05. 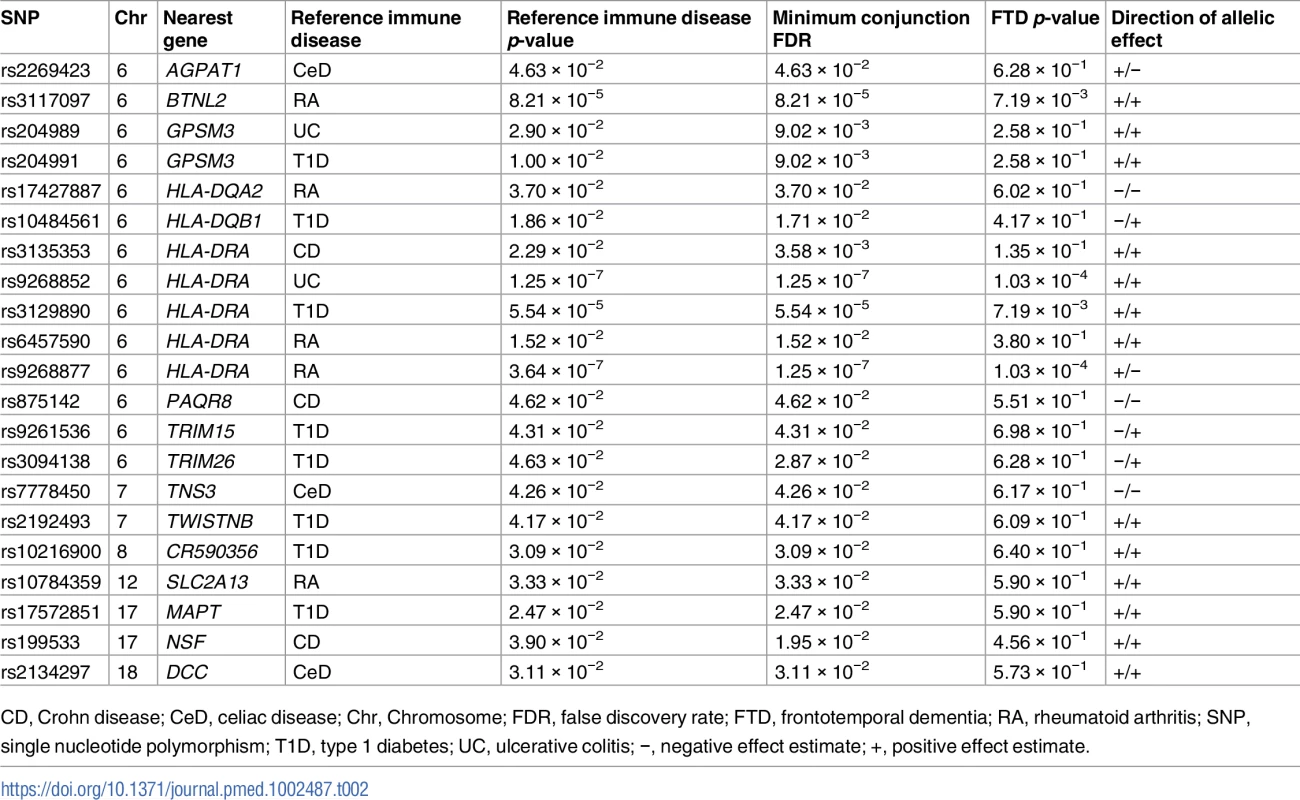
CD, Crohn disease; CeD, celiac disease; Chr, Chromosome; FDR, false discovery rate; FTD, frontotemporal dementia; RA, rheumatoid arthritis; SNP, single nucleotide polymorphism; T1D, type 1 diabetes; UC, ulcerative colitis; −, negative effect estimate; +, positive effect estimate. Outside the HLA region, we found 7 other FTD - and immune-associated SNPs (Fig 2; Table 2), including 2 in strong LD that mapped to the H1 haplotype of microtubule associated protein tau (MAPT) (LD: rs199533 and rs17572851; nearest genes: NSF and MAPT, pairwise D′ = 1, r2 = 0.94). Beyond MAPT, we found 5 additional novel loci associated with increased FTD risk, namely, (1) rs2192493 (Chr 7, nearest gene = TWISTNB), (2) rs7778450 (Chr 7, nearest gene = TNS3), (3) rs10216900 (Chr 8, nearest gene = CR590356), (4) rs10784359 (Chr 12, nearest gene = SLC2A13), and (5) rs2134297 (Chr 18, nearest gene = DCC) (see Table 2 for additional details).
Modest genetic enrichment between immune-mediated disease and PSP, CBD, and ALS
To evaluate the specificity of the shared genetic overlap between FTD and immune-mediated disease, we also evaluated overlap between the 6 immune-mediated diseases and CBD, PSP, and ALS. For CBD and PSP, a few of the immune-mediated diseases produced genetic enrichment comparable to that seen for FTD (S1–S3 Figs; S2–S4 Tables). For example, we found 150-fold genetic enrichment between CBD and CeD and 180-fold enrichment between PSP and RA. In contrast, we found minimal enrichment between ALS and the immune-mediated diseases tested, with the highest levels of enrichment between ALS and RA (up to 20-fold) and between ALS and CeD (up to 15-fold).
At a conjunction FDR < 0.05, we identified several SNPs associated with both immune-mediated disease and CBD, PSP, or ALS (S4–S6 Figs; S2–S4 Tables). Few of the SNPs shared between CBD, PSP, or ALS and immune-mediated disease mapped to the HLA region. Only 2 PSP–immune SNPs mapped to the region of MLN and IRF4 on Chr 6, and no CBD–immune or ALS–immune SNPs mapped to the HLA region (S4–S6 Figs; S2–S4 Tables).
Beyond the HLA region, we found several overlapping loci between the immune - mediated diseases and CBD, PSP, and ALS (S4–S6 Figs; S2–S4 Tables). For PSP, these were (1) rs7642229 with CeD (Chr 3, nearest gene = XCR1, FDR = 1.74 × 10⁻²); (2) rs11718668 with CeD (Chr 3, nearest gene = TERC, FDR = 3.00 × 10⁻²); (3) rs12203592 with CeD (Chr 6, nearest gene = IRF4, FDR = 4.17 × 10⁻²); (4) rs1122554 with RA (Chr 6, nearest gene = MLN, FDR = 2.09 × 10⁻²); and (5) rs3748256 with RA (Chr 11, nearest gene = FAM76B, FDR = 2.09 × 10⁻²). For ALS, these were (1) rs3828599 with CeD (Chr 5, nearest gene = GPX3, FDR = 2.27 × 10⁻²) and (2) rs10488631 with RA (Chr 7, nearest gene = TNPO3, FDR = 3.42 × 10⁻²).
cis-eQTL expression
To investigate whether shared FTD–immune SNPs modify gene expression, we evaluated cis-eQTLs in both brain and blood tissue types. At a previously established conservative Bonferroni-corrected p-value < 3.9 × 10⁻⁵ [34], we found significant cis-associations between shared SNPs and genes in the HLA region on Chr 6 in peripheral blood mononuclear cells, lymphoblasts, and the human brain (see S5 Table for gene expression associated with each SNP). We also found that rs199533 and rs17572851 on Chr 17 were significantly associated with MAPT (p = 2 × 10⁻¹²) expression in the brain. Beyond the HLA and MAPT regions, notable cis-eQTLs included rs10784359 and LRRK2 (p = 1.40 × 10 − 7) and rs2192493 and TBKBP1 (p = 1.29 × 10⁻⁶) (see S5 Table).
Protein–protein and co-expression networks
We found physical interaction and gene co-expression networks for the FTD–immune pleiotropic genes with significant cis-eQTLs (at a Bonferroni-corrected p-value < 3.9 × 10⁻⁵). We found robust co-expression between various HLA classes, further suggesting that large portions of the HLA region, rather than a few individual loci, may be involved with FTD (Fig 4; S6 Table). Interestingly, we found that several non-HLA functionally expressed FTD–immune genes, namely, LRRK2, PGBD5, and TBKBP1, showed co-expression with HLA-associated genes (Fig 4).
Fig. 4. Network interaction graph predominantly illustrating co-expression and shared protein domains for functionally expressed pleiotropic genes between frontotemporal dementia (FTD) and immune-related diseases. 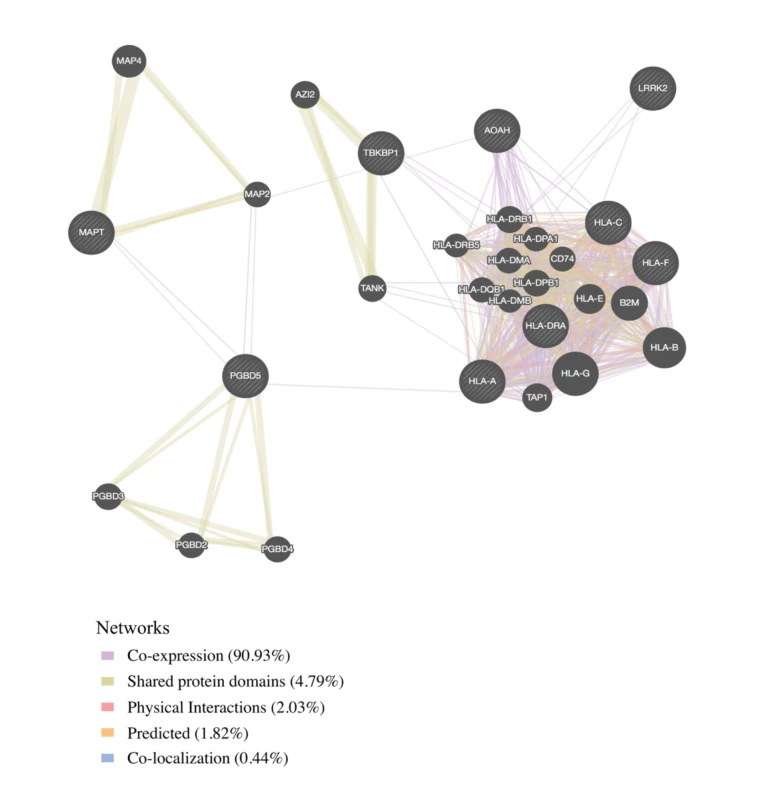
Genetic expression in FTD brains compared to controls
To investigate whether the FTD–immune pleiotropic genes with significant cis-eQTLs are differentially expressed in FTD brains, we compared gene expression in FTD-U brains to that in brains from neurologically healthy controls. We found significantly different levels of HLA gene expression in FTD-U brains compared to control brains (Table 3). This was true of FTD-U brains regardless of progranulin gene (GRN) mutation status. In spite of the fact that the FTD GWAS used to identify these genes was based on patients with sporadic FTD (without GRN mutations), GRN mutation carriers showed the greatest differences in HLA gene expression (Fig 5; Table 3). These findings are compatible with prior work showing microglial-mediated immune dysfunction in GRN mutation carriers [3].
Fig. 5. Pleiotropic genes between frontotemporal dementia (FTD) and immune-related diseases are elevated in brains of patients with FTD with GRN mutation. 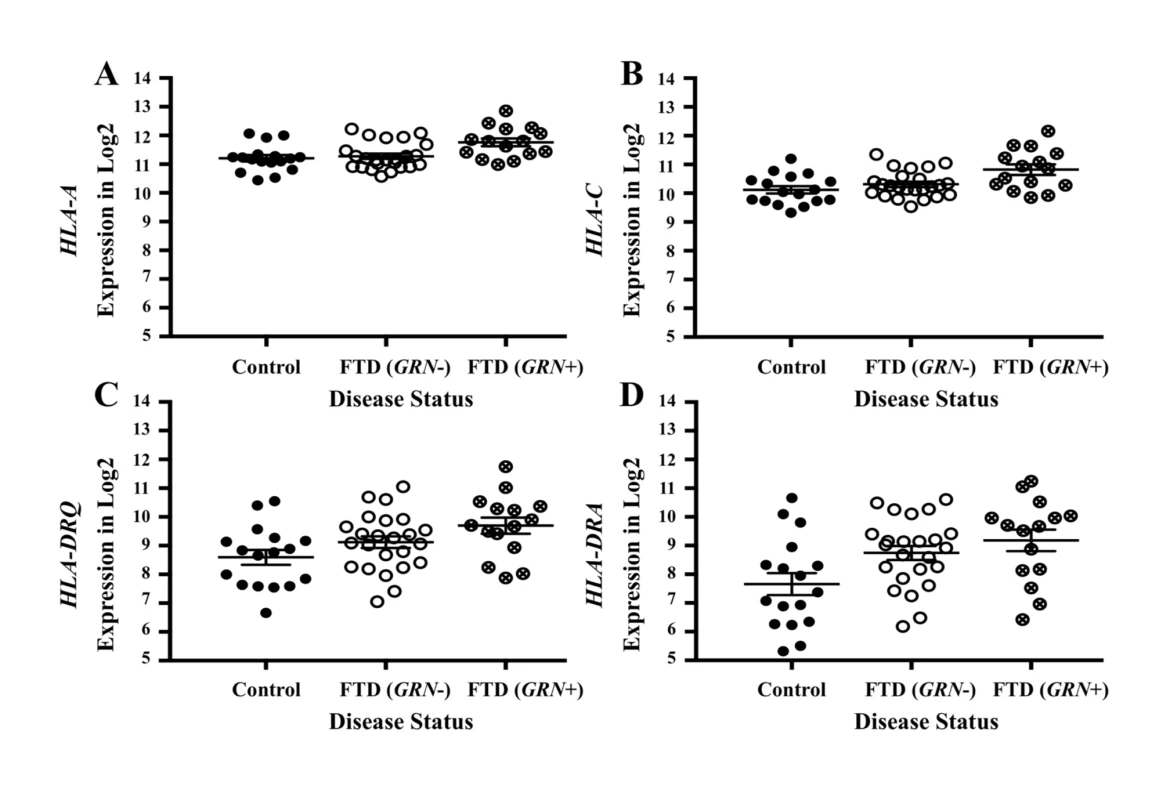
Expression for the genes with the largest effect sizes are plotted: (A) HLA-A, (B) HLA-C, (C) HLA-DRQ, and (D) HLA-DRA. Expression values were obtained from GSE13162 for FTD-U brains with and without GRN mutations and neuropathology-free controls. Horizontal bar represents mean ± SEM. Tab. 3. Genes associated with frontotemporal dementia (FTD) and immune-mediated disease differentially altered in patients with frontotemporal lobar degeneration with ubiquitinated inclusions (FTD-U) versus controls. 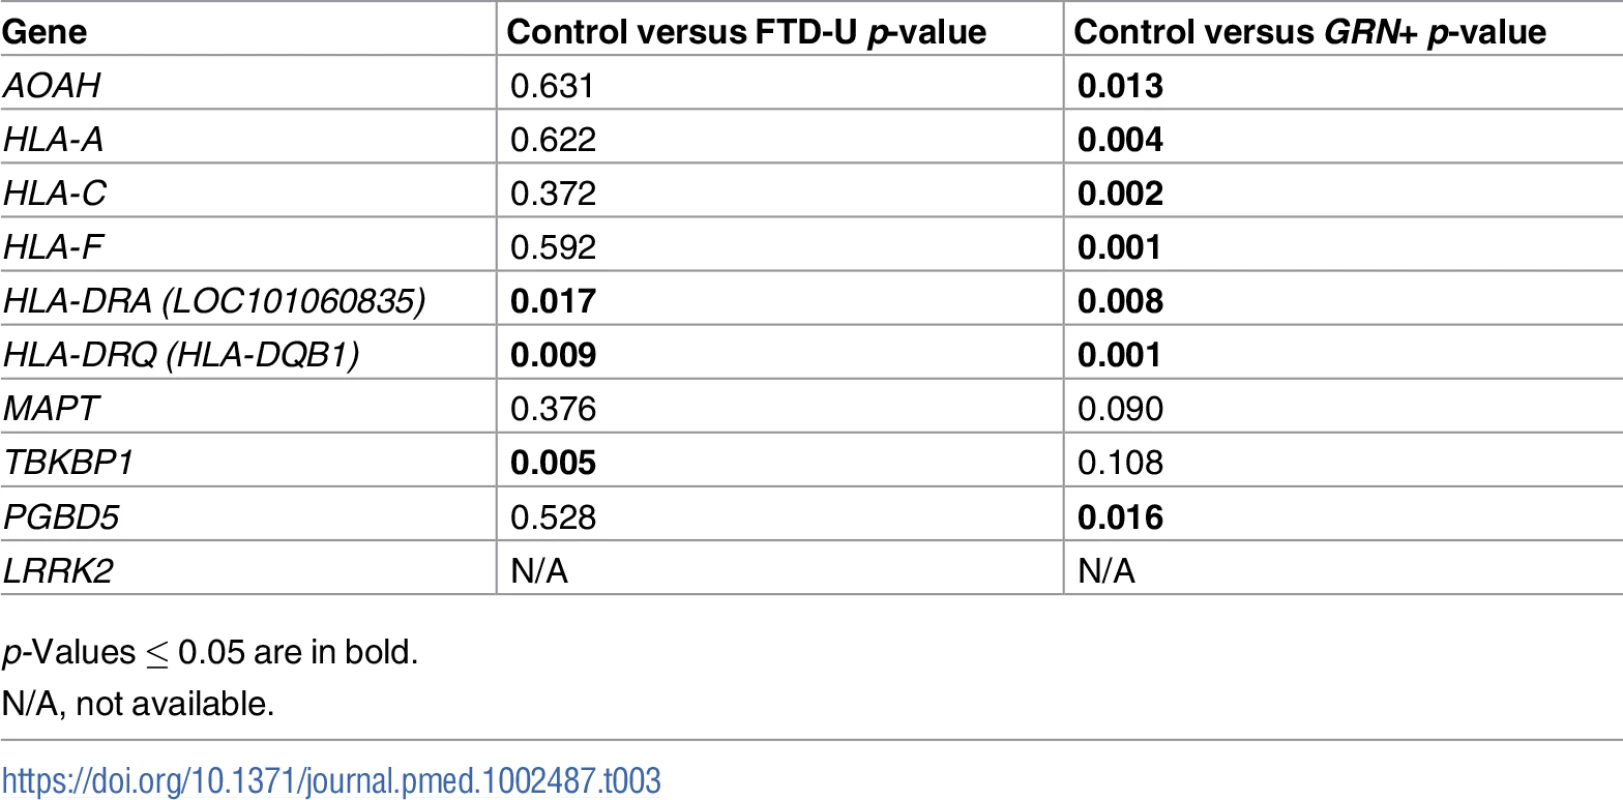
p-Values ≤ 0.05 are in bold. Microglial enrichment
For the FTD–immune pleiotropic genes with significant cis-eQTLs, across different central nervous system (CNS) cell types, we found significantly greater expression within microglia compared to neurons or fetal astrocytes (Fig 6A; Table 4). Interestingly, HLA genes showed the greatest degree of differential expression. Four of the FTD–immune HLA-associated genes, namely HLA-DRA, AOAH, HLA-A, and HLA-C, showed highest expression in microglia (ranging from 10 to 60 fragments per kilobase of transcript per million; see Fig 6B). In addition, MAPT was predominantly expressed in neurons, LRRK2 in microglia, PGBD5 in neurons, and TBKBP1 in fetal astrocytes (Figs 6B and S7–S9).
Fig. 6. Microglia enrichment in genes associated with frontotemporal dementia (FTD) and immune-mediated disease. 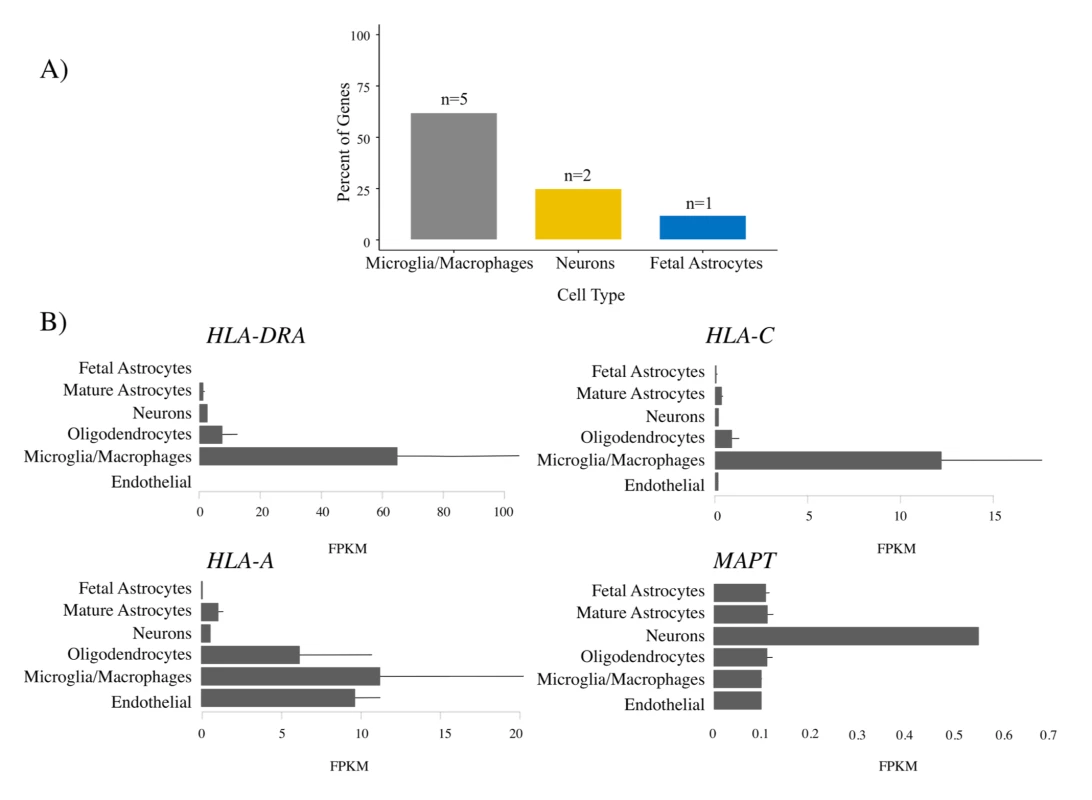
FTD–immune genes were analyzed to determine the cell type in which each gene was most highly expressed [32]. (A) Bar plots showing the relative number of genes most highly expressed in each cell type. No genes were most highly expressed in endothelial cells or oligodendrocytes. See Table 4 for individual gene names. (B) Individual bar plots showing cell-type-specific expression for genes with the largest effect size. Note that the horizontal scale is not the same in all the plots. FPKM, fragments per kilobase of transcript per million. Tab. 4. Enrichment of genes associated with frontotemporal dementia (FTD) and immune-mediated disease in microglia compared with other central nervous system cells. 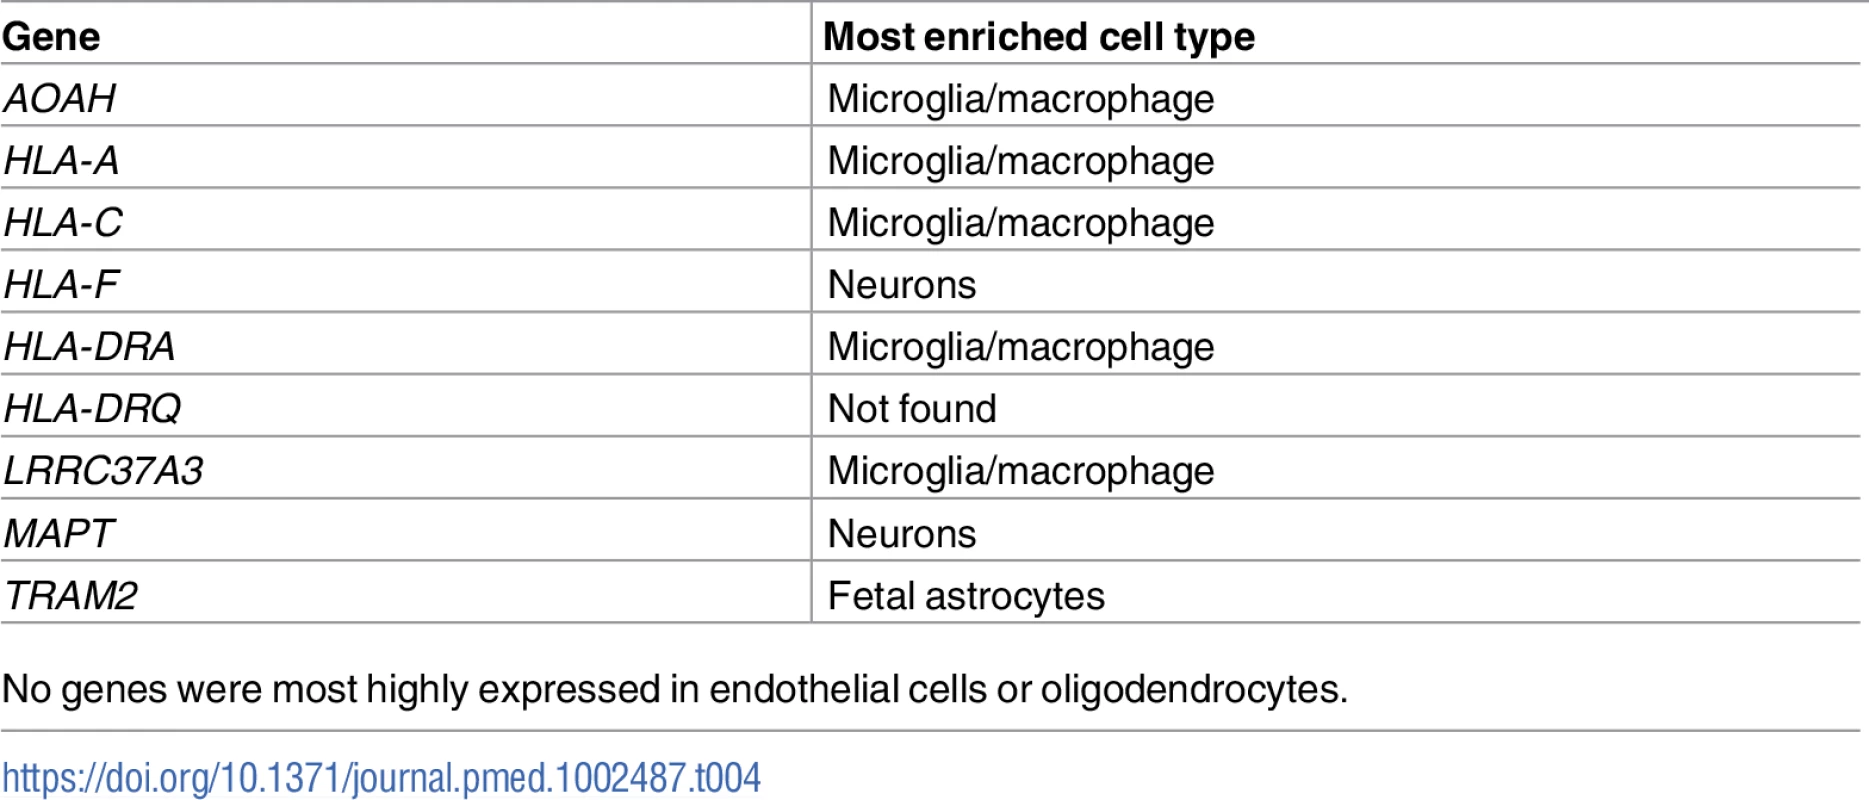
No genes were most highly expressed in endothelial cells or oligodendrocytes. Discussion
We systematically assessed genetic overlap between 4 FTD-related disorders and several immune-mediated diseases. We found extensive genetic overlap between FTD and immune-mediated disease particularly within the HLA region on Chr 6, a region rich in genes associated with microglial function. This genetic enrichment was specific to FTD and did not extend to CBD, PSP, or ALS. Further, we found that shared FTD–immune gene variants were differentially expressed in FTD patients compared with controls, and in microglia compared with other CNS cells. Beyond the HLA region, by leveraging statistical power from large immune-mediated GWASs, we detected novel candidate FTD associations requiring validation within LRRK2, TBKBP1, and PGBD5. Considered together, these findings suggest that various microglia and inflammation-associated genes, particularly within the HLA region, may play a critical and selective role in FTD pathogenesis.
By combining GWASs from multiple studies and applying a pleiotropic approach, we identified genetic variants jointly associated with FTD-related disorders and immune-mediated disease. We found that the strength of genetic overlap with immune-mediated disease varies markedly across FTD-related disorders, with the strongest pleiotropic effects associated with FTD, followed by CBD and PSP, and the weakest pleiotropic effects associated with ALS. We identified 8 FTD - and immune-associated loci that mapped to the HLA region, a concentration of loci that was not observed for the other disorders. Indeed, only 2 PSP–immune pleiotropic SNPs and no CBD–immune or ALS–immune pleiotropic SNPs mapped to the HLA region. Previous work has identified particular HLA genes associated with CBD, PSP, and ALS [35,36]. In contrast, our current findings implicate large portions of the HLA region in the pathogenesis of FTD. Together, these results suggest that each disorder across the larger FTD spectrum has a unique relationship with the HLA region.
Our results also indicate that functionally expressed FTD–immune shared genetic variants are differentially expressed in FTD brains compared to controls and in microglia compared to other CNS cell types (Fig 6). Microglia play a role in the pathophysiology of GRN+ FTD. Progranulin is expressed in microglia [37], and GRN haploinsufficiency is associated with abnormal microglial activation and neurodegeneration [3]. It is perhaps expected, therefore, that GRN+ brains show differential expression of FTD–immune genes, even though these genetic variants were derived from a GWAS of patients with sporadic FTD (who lack GRN or other established FTD mutations). More surprising is the presence of similar enrichment in GRN − brains, suggesting that dysfunction of microglial-centered immune networks may be a common feature of FTD pathogenesis.
By leveraging statistical power from the large immune-mediated GWASs, we identified novel candidate FTD associations requiring validation within LRRK2, TBKBP1, and PGBD5 and confirmed previously shown FTD-associated signal within the MAPT region. LRRK2 mutations are a cause of Parkinson disease [38] and CD [39]. We previously described a potential link between FTD and the LRRK2 locus [40], and another study using a small sample showed that LRRK2 mutations may increase FTD risk [41]. Together, these results suggest that the extended LRRK2 locus might influence FTD despite common genetic variants within LRRK2 not reaching genome-wide significance in a large FTD GWAS [5]. We suggest that increased expression of LRRK2 in microglia results in proinflammatory responses, possibly by modulating TNF-alpha secretion [42]. TBKBP1 also modulates TNF-alpha signaling by binding to TBK1 (TANK binding kinase 1) [43]; rare pathogenic variants in TBK1 cause FTD-ALS [44–46]. Importantly, elevated CSF levels of TNF-alpha are a core feature of FTD [6,47]. Building on these findings, in our bioinformatics “network”-based analysis, we found that both LRRK2 and TBKBP1 interact with genes within the HLA region (Fig 4). Further, physical interactions between MAPT and the HLA network are compatible with research suggesting that under different conditions reactive microglia can either drive or mitigate tau pathology [48,49]. MAPT mutations, which disrupt the normal binding of tau protein to tubulin, account for a large proportion of familial FTD cases [50]. Together, these findings suggest that LRRK2, TBKBP1, and MAPT may, at least in part, influence FTD pathogenesis via HLA-related mechanisms.
This study has limitations. Particularly, in the original datasets that form the basis of our analysis, diagnosis of FTD was established clinically. Given the clinical overlap among neurodegenerative diseases, we cannot exclude the potential influence of clinical misdiagnosis. As such, our findings would benefit from confirmation in large pathologically confirmed cohorts. In addition, given the complex interconnectedness of the HLA region (see Fig 4), we also were not able to define the specific gene or genes on Chr 6 responsible for our pleiotropic signal. However, given the number of HLA loci associated with increased FTD risk, it may be the case that no single HLA variant will be clinically informative; rather, an additive combination of these microglia-associated genetic variants may better inform FTD risk. This possibility is supported by our observation that the expression levels of FTD-immune shared genetic variants differ on average between FTD brains and controls, but with considerable overlap between the two groups, again suggesting that no single variant is likely to be the determinant of FTD risk (Fig 5). Further, we acknowledge the lack of transcriptomic and epigenetic data that would help to identify possible causal associations and mechanisms driving our pleotropic signal.
In conclusion, across a large cohort (total n = 192,886 cases and controls), we used pleiotropy between FTD-related disorders and immune-mediated disease to identify several genes within the HLA region that are expressed within microglia and differentially expressed in the brains of patients with FTD. Building on prior work [6,7], our results support a disease model in which immune dysfunction is central to the pathophysiology of a subset of FTD cases. These findings have important implications for future work in FTD focused on monitoring microglial activation as a marker of disease progression and investigating anti-inflammatory treatments as modifiers of disease outcome.
Supporting Information
Zdroje
1. Vieira RT, Caixeta L, Machado S, Silva AC, Nardi AE, Arias-Carrión O, et al. Epidemiology of early-onset dementia: a review of the literature. Clin Pract Epidemiol Ment Health. 2013;9(1):88–95.
2. Arnold SE, Han L-Y, Clark CM, Grossman M, Trojanowski JQ. Quantitative neurohistological features of frontotemporal degeneration. Neurobiol Aging. 2000;21(6):913–9. 11124442
3. Lui H, Zhang J, Makinson S, Cahill M, Kelley K, Huang H, et al. Progranulin deficiency promotes circuit-specific synaptic pruning by microglia via complement activation. Cell. 2016;165(4):921–35. doi: 10.1016/j.cell.2016.04.001 27114033
4. Yin F, Banerjee R, Thomas B, Zhou P, Qian L, Jia T, et al. Exaggerated inflammation, impaired host defense, and neuropathology in progranulin-deficient mice. J Exp Med. 2010;207(1):117–28. doi: 10.1084/jem.20091568 20026663
5. Ferrari R, Hernandez DG, Nalls MA, Rohrer JD, Ramasamy A, Kwok JB, et al. Frontotemporal dementia and its subtypes: a genome-wide association study. Lancet Neurol. 2014;13(7):686–99. doi: 10.1016/S1474-4422(14)70065-1 24943344
6. Miller ZA, Rankin KP, Graff-Radford NR, Takada LT, Sturm VE, Cleveland CM, et al. TDP-43 frontotemporal lobar degeneration and autoimmune disease. J Neurol Neurosurg Psychiatry. 2013;84(9):956–62. doi: 10.1136/jnnp-2012-304644 23543794
7. Miller ZA, Sturm VE, Camsari GB, Karydas A, Yokoyama JS, Grinberg LT, et al. Increased prevalence of autoimmune disease within C9 and FTD/MND cohorts completing the picture. Neurol Neuroimmunol Neuroinflamm. 2016;3(6):e301. doi: 10.1212/NXI.0000000000000301 27844039
8. Stearns FW. One hundred years of pleiotropy: a retrospective. Genetics. 2010;186(3):767–73. doi: 10.1534/genetics.110.122549 21062962
9. Olney NT, Spina S, Miller BL. Frontotemporal dementia. Neurol Clin. 2017;35(2):339–74. doi: 10.1016/j.ncl.2017.01.008 28410663
10. Josephs KA. Frontotemporal dementia and related disorders: deciphering the enigma. Ann Neurol. 2008;64(1):4–14. doi: 10.1002/ana.21426 18668533
11. Franke A, McGovern DP, Barrett JC, Wang K, Radford-Smith GL, Ahmad T, et al. Genome-wide meta-analysis increases to 71 the number of confirmed Crohn’s disease susceptibility loci. Nat Genet. 2010;42(12):1118–25. doi: 10.1038/ng.717 21102463
12. Anderson CA, Boucher G, Lees CW, Franke A, D’Amato M, Taylor KD, et al. Meta-analysis identifies 29 additional ulcerative colitis risk loci, increasing the number of confirmed associations to 47. Nat Genet. 2011;43(3):246–52. doi: 10.1038/ng.764 21297633
13. Stahl EA, Raychaudhuri S, Remmers EF, Xie G, Eyre S, Thomson BP, et al. Genome-wide association study meta-analysis identifies seven new rheumatoid arthritis risk loci. Nat Genet. 2010;42(6):508–14. doi: 10.1038/ng.582 20453842
14. Barrett JC, Clayton DG, Concannon P, Akolkar B, Cooper JD, Erlich HA, et al. Genome-wide association study and meta-analysis find that over 40 loci affect risk of type 1 diabetes. Nat Genet. 2009;41(6):703–7. doi: 10.1038/ng.381 19430480
15. Dubois PC, Trynka G, Franke L, Hunt KA, Romanos J, Curtotti A, et al. Multiple common variants for celiac disease influencing immune gene expression. Nat Genet. 2010;42(4):295–302. doi: 10.1038/ng.543 20190752
16. Ellinghaus D, Ellinghaus E, Nair RP, Stuart PE, Esko T, Metspalu A, et al. Combined analysis of genome-wide association studies for Crohn disease and psoriasis identifies seven shared susceptibility loci. Am J Hum Genet. 2012;90(4):636–47. doi: 10.1016/j.ajhg.2012.02.020 22482804
17. Neary D, Snowden JS, Gustafson L, Passant U, Stuss D, Black SA, et al. Frontotemporal lobar degeneration: a consensus on clinical diagnostic criteria. Neurology. 1998;51(6):1546–54. 9855500
18. Kouri N, Ross OA, Dombroski B, Younkin CS, Serie DJ, Soto-Ortolaza A, et al. Genome-wide association study of corticobasal degeneration identifies risk variants shared with progressive supranuclear palsy. Nat Commun. 2015;6 : 7247. doi: 10.1038/ncomms8247 26077951
19. Dickson DW, Bergeron C, Chin SS, Duyckaerts C, Horoupian D, Ikeda K, et al. Office of Rare Diseases neuropathologic criteria for corticobasal degeneration. J Neuropathol Exp Neurol. 2002;61(11):935–46. 12430710
20. Höglinger GU, Melhem NM, Dickson DW, Sleiman PM, Wang L-S, Klei L, et al. Identification of common variants influencing risk of the tauopathy progressive supranuclear palsy. Nat Genet. 2011;43(7):699–705. doi: 10.1038/ng.859 21685912
21. van Rheenen W, Shatunov A, Dekker AM, McLaughlin RL, Diekstra FP, Pulit SL, et al. Genome-wide association analyses identify new risk variants and the genetic architecture of amyotrophic lateral sclerosis. Nat Genet. 2016;48(9):1043–8. doi: 10.1038/ng.3622 27455348
22. Andreassen OA, Djurovic S, Thompson WK, Schork AJ, Kendler KS, O’Donovan MC, et al. Improved detection of common variants associated with schizophrenia by leveraging pleiotropy with cardiovascular-disease risk factors. Am J Hum Genet. 2013;92(2):197–209. doi: 10.1016/j.ajhg.2013.01.001 23375658
23. Andreassen OA, Thompson WK, Schork AJ, Ripke S, Mattingsdal M, Kelsoe JR, et al. Improved detection of common variants associated with schizophrenia and bipolar disorder using pleiotropy-informed conditional false discovery rate. PLoS Genet. 2013;9(4):e1003455. doi: 10.1371/journal.pgen.1003455 23637625
24. Desikan RS, Schork AJ, Wang Y, Witoelar A, Sharma M, McEvoy LK, et al. Genetic overlap between Alzheimer’s disease and Parkinson’s disease at the MAPT locus. Mol Psychiatry. 2015;20(12):1588–95. doi: 10.1038/mp.2015.6 25687773
25. Yokoyama JS, Wang Y, Schork AJ, Thompson WK, Karch CM, Cruchaga C, et al. Association between genetic traits for immune-mediated diseases and Alzheimer disease. JAMA Neurol. 2016;73(6):691–7. doi: 10.1001/jamaneurol.2016.0150 27088644
26. Yokoyama JS, Karch CM, Fan CC, Bonham LW, Kouri N, Ross OA, et al. Shared genetic risk between corticobasal degeneration, progressive supranuclear palsy, and frontotemporal dementia. Acta Neuropathol. 2017;133(5):825–37. doi: 10.1007/s00401-017-1693-y 28271184
27. Ramasamy A, Trabzuni D, Guelfi S, Varghese V, Smith C, Walker R, et al. Genetic variability in the regulation of gene expression in ten regions of the human brain. Nat Neurosci. 2014;17(10):1418–28. doi: 10.1038/nn.3801 25174004
28. Westra HJ, Peters MJ, Esko T, Yaghootkar H, Schurmann C, Kettunen J, et al. Systematic identification of trans eQTLs as putative drivers of known disease associations. Nat Genet. 2013;45(10):1238–43. doi: 10.1038/ng.2756 24013639
29. Warde-Farley D, Donaldson SL, Comes O, Zuberi K, Badrawi R, Chao P, et al. The genemania prediction server: biological network integration for gene prioritization and predicting gene function. Nucleic Acids Res. 2010;38(Web Server issue):W214–20. doi: 10.1093/nar/gkq537 20576703
30. Mostafavi S, Ray D, Warde-Farley D, Grouios C, Morris Q. GeneMANIA: a real-time multiple association network integration algorithm for predicting gene function. Genome Biol. 2008;9(Suppl 1):S4.
31. Chen-Plotkin AS, Geser F, Plotkin JB, Clark CM, Kwong LK, Yuan W, et al. Variations in the progranulin gene affect global gene expression in frontotemporal lobar degeneration. Hum Mol Genet. 2008;17(10):1349–62. doi: 10.1093/hmg/ddn023 18223198
32. Zhang Y, Chen K, Sloan SA, Bennett ML, Scholze AR, O’Keeffe S, et al. An RNA-sequencing transcriptome and splicing database of glia, neurons, and vascular cells of the cerebral cortex. J Neurosci. 2014;34(36):11929–47. doi: 10.1523/JNEUROSCI.1860-14.2014 25186741
33. Zhu Z, Zhang F, Hu H, Bakshi A, Robinson MR, Powell JE, et al. Integration of summary data from GWAS and eQTL studies predicts complex trait gene targets. Nat Genet. 2016;48(5):481–7. doi: 10.1038/ng.3538 27019110
34. Karch CM, Ezerskiy LA, Bertelsen S, Goate AM. Alzheimer’s disease risk polymorphisms regulate gene expression in the ZCWPW1 and the CELF1 loci. PLoS ONE. 2016;11(2):e0148717. doi: 10.1371/journal.pone.0148717 26919393
35. Ishizawa K, Dickson DW. Microglial activation parallels system degeneration in progressive supranuclear palsy and corticobasal degeneration. J Neuropathol Exp Neurol. 2001;60(6):647–57. 11398841
36. Dattola V, Famà F, Russo M, Calabrò RS, Logiudice AL, Grasso MG, et al. Multiple sclerosis and amyotrophic lateral sclerosis: a human leukocyte antigen challenge. Neurol Sci. 2017;38(8):1501–3. doi: 10.1007/s10072-017-2939-0 28421301
37. Toh H, Chitramuthu BP, Bennett HPJ, Bateman A. Structure, function, and mechanism of progranulin; the brain and beyond. J Mol Neurosci. 2011;45(3):538. doi: 10.1007/s12031-011-9569-4 21691802
38. Healy DG, Falchi M, O’Sullivan SS, Bonifati V, Durr A, Bressman S, et al. Phenotype, genotype, and worldwide genetic penetrance of LRRK2-associated Parkinson’s disease: a case-control study. Lancet Neurol. 2008;7(7):583–90. doi: 10.1016/S1474-4422(08)70117-0 18539534
39. Barrett JC, Hansoul S, Nicolae DL, Cho JH, Duerr RH, Rioux JD, et al. Genome-wide association defines more than 30 distinct susceptibility loci for Crohn’s disease. Nat Genet. 2008;40(8):955–62. doi: 10.1038/ng.175 18587394
40. Ferrari R, Wang Y, Vandrovcova J, Guelfi S, Witeolar A, Karch CM, et al. Genetic architecture of sporadic frontotemporal dementia and overlap with Alzheimer’s and Parkinson’s diseases. J Neurol Neurosurg Psychiatry. 2017;88(2):152–64. doi: 10.1136/jnnp-2016-314411 27899424
41. Dächsel JC, Ross OA, Mata IF, Kachergus J, Toft M, Cannon A, et al. Lrrk2 G2019S substitution in frontotemporal lobar degeneration with ubiquitin-immunoreactive neuronal inclusions. Acta Neuropathol. 2007;113(5):601–6. doi: 10.1007/s00401-006-0178-1 17151837
42. Moehle MS, Webber PJ, Tse T, Sukar N, Standaert DG, DeSilva TM, et al. LRRK2 inhibition attenuates microglial inflammatory responses. J Neurosci. 2012;32(5):1602–11. doi: 10.1523/JNEUROSCI.5601-11.2012 22302802
43. Bouwmeester T, Bauch A, Ruffner H, Angrand PO, Bergamini G, Croughton K, et al. A physical and functional map of the human tnf-alpha/nf-kappa B signal transduction pathway. Nat Cell Biol. 2004;6(2):97–105. doi: 10.1038/ncb1086 14743216
44. Cirulli ET, Lasseigne BN, Petrovski S, Sapp PC, Dion PA, Leblond CS, et al. Exome sequencing in amyotrophic lateral sclerosis identifies risk genes and pathways. Science. 2015;347(6229):1436–41. doi: 10.1126/science.aaa3650 25700176
45. Freischmidt A, Wieland T, Richter B, Ruf W, Schaeffer V, Müller K, et al. Haploinsufficiency of TBK1 causes familial ALS and fronto-temporal dementia. Nat Neurosci. 2015;18(5):631–6. doi: 10.1038/nn.4000 25803835
46. Pottier C, Bieniek KF, Finch N, van de Vorst M, Baker M, Perkersen R, et al. Whole-genome sequencing reveals important role for TBK1 and OPTN mutations in frontotemporal lobar degeneration without motor neuron disease. Acta Neuropathol. 2015;130(1):77–92. doi: 10.1007/s00401-015-1436-x 25943890
47. Sjögren M, Folkesson S, Blennow K, Tarkowski E. Increased intrathecal inflammatory activity in frontotemporal dementia: pathophysiological implications. J Neurol Neurosurg Psychiatry. 2004;75(8):1107–11. doi: 10.1136/jnnp.2003.019422 15258209
48. Maphis N, Xu G, Kokiko-Cochran ON, Jiang S, Cardona A, Ransohoff RM, et al. Reactive microglia drive tau pathology and contribute to the spreading of pathological tau in the brain. Brain. 2015;138(6):1738–55.
49. Funk KE, Mirbaha H, Jiang H. Holtzman DM, Diamond MI. Distinct therapeutic mechanisms of tau antibodies. J Biol Chem. 2015;290(35):21652–62. doi: 10.1074/jbc.M115.657924 26126828
50. Rizzu P, Van Swieten JC, Joosse M, Hasegawa M, Stevens M, Tibben A, et al. High prevalence of mutations in the microtubule-associated protein tau in a population study of frontotemporal dementia in the Netherlands. Am J Hum Genet. 1999;64(2):414–21. doi: 10.1086/302256 9973279
Štítky
Interní lékařství
Článek vyšel v časopisePLOS Medicine
Nejčtenější tento týden
2018 Číslo 1- Není statin jako statin aneb praktický přehled rozdílů jednotlivých molekul
- Magnosolv a jeho využití v neurologii
- Moje zkušenosti s Magnosolvem podávaným pacientům jako profylaxe migrény a u pacientů s diagnostikovanou spazmofilní tetanií i při normomagnezémii - MUDr. Dana Pecharová, neurolog
- Biomarker NT-proBNP má v praxi široké využití. Usnadněte si jeho vyšetření POCT analyzátorem Afias 1
- Antikoagulační léčba u pacientů před operačními výkony
-
Všechny články tohoto čísla
- What about drinking is associated with shorter life in poorer people?
- Life course socioeconomic position, alcohol drinking patterns in midlife, and cardiovascular mortality: Analysis of Norwegian population-based health surveys
- Pelvic inflammatory disease risk following negative results from chlamydia nucleic acid amplification tests (NAATs) versus non-NAATs in Denmark: A retrospective cohort
- Increased risk of ischemic heart disease, hypertension, and type 2 diabetes in women with previous gestational diabetes mellitus, a target group in general practice for preventive interventions: A population-based cohort study
- Sexually transmitted infections in the era of antiretroviral-based HIV prevention: Priorities for discovery research, implementation science, and community involvement
- Traumatic brain injury and the risk of dementia diagnosis: A nationwide cohort study
- Association between intake of less-healthy foods defined by the United Kingdom's nutrient profile model and cardiovascular disease: A population-based cohort study
- Progression of the first stage of spontaneous labour: A prospective cohort study in two sub-Saharan African countries
- The cost-effectiveness of alternative vaccination strategies for polyvalent meningococcal vaccines in Burkina Faso: A transmission dynamic modeling study
- PD-L1 checkpoint inhibition and anti-CTLA-4 whole tumor cell vaccination counter adaptive immune resistance: A mouse neuroblastoma model that mimics human disease
- Safety and pharmacokinetics of the Fc-modified HIV-1 human monoclonal antibody VRC01LS: A Phase 1 open-label clinical trial in healthy adults
- Immune-related genetic enrichment in frontotemporal dementia: An analysis of genome-wide association studies
- Long-term trends in mortality and AIDS-defining events after combination ART initiation among children and adolescents with perinatal HIV infection in 17 middle- and high-income countries in Europe and Thailand: A cohort study
- What’s coming for health science and policy in 2018? Global experts look ahead in their field
- Brain and blood metabolite signatures of pathology and progression in Alzheimer disease: A targeted metabolomics study
- Estimated mortality on HIV treatment among active patients and patients lost to follow-up in 4 provinces of Zambia: Findings from a multistage sampling-based survey
- From macro- to microfactors in health: Social science approaches in research on sexually transmitted infections
- The WHO 2016 verbal autopsy instrument: An international standard suitable for automated analysis by InterVA, InSilicoVA, and Tariff 2.0
- Long-term risks and benefits associated with cesarean delivery for mother, baby, and subsequent pregnancies: Systematic review and meta-analysis
- PLOS Medicine
- Archiv čísel
- Aktuální číslo
- Informace o časopisu
Nejčtenější v tomto čísle- Traumatic brain injury and the risk of dementia diagnosis: A nationwide cohort study
- Pelvic inflammatory disease risk following negative results from chlamydia nucleic acid amplification tests (NAATs) versus non-NAATs in Denmark: A retrospective cohort
- PD-L1 checkpoint inhibition and anti-CTLA-4 whole tumor cell vaccination counter adaptive immune resistance: A mouse neuroblastoma model that mimics human disease
- Safety and pharmacokinetics of the Fc-modified HIV-1 human monoclonal antibody VRC01LS: A Phase 1 open-label clinical trial in healthy adults
Kurzy
Zvyšte si kvalifikaci online z pohodlí domova
Autoři: prof. MUDr. Vladimír Palička, CSc., Dr.h.c., doc. MUDr. Václav Vyskočil, Ph.D., MUDr. Petr Kasalický, CSc., MUDr. Jan Rosa, Ing. Pavel Havlík, Ing. Jan Adam, Hana Hejnová, DiS., Jana Křenková
Autoři: MUDr. Irena Krčmová, CSc.
Autoři: MDDr. Eleonóra Ivančová, PhD., MHA
Autoři: prof. MUDr. Eva Kubala Havrdová, DrSc.
Všechny kurzyPřihlášení#ADS_BOTTOM_SCRIPTS#Zapomenuté hesloZadejte e-mailovou adresu, se kterou jste vytvářel(a) účet, budou Vám na ni zaslány informace k nastavení nového hesla.
- Vzdělávání


