
Remote Pulse Oximetry Imaging – Fundamentals and Applications
Authors:
Nikolai Blanik 1; Boudewijn Venema 1; Vladimir Blazek 1; Steffen Leonhardt 1
Authors‘ workplace:
Philips Chair for Medical Information Technology, Helmholtz-Institute for Biomedical Engineering, RWTH Aachen University, Aachen, Germany
1
Published in:
Lékař a technika - Clinician and Technology No. 3, 2014, 44, 5-11
Category:
Original research
Overview
The remote photoplethysmography imaging (PPGI) system is a camera-based monitoring device for non-contact analysis of skin perfusion allowing measurement of vital parameters, like heart rate and respiration rate. PPGI is based on the same principle as classic photoplethysmography (PPG), i.e. measurement of optical absorption and scattering properties of skin. Pulse oximetry is a well-established clinical application of PPG to determine arterial blood oxygenation and this has been adapted for use with the PPGI setup. We describe the theoretical correlation between the measurement results and expected level of oxygen saturation. The feasibility of the proposed system is demonstrated by confirming the theory with results from tests with human volunteers in a laboratory setting and in an operating theatre during an ongoing (clinical) animal trial. Compared with measurement devices based on skin contact, the PPGI offers several advantages. It allows unobtrusive remote measurement as well as evaluation of vital parameters with spatial resolution. Therefore, PPGI is particularly suited for long-term monitoring of freely selectable and potentially sensitive skin regions, e.g. for preterm neonates being cared for in an incubator.
Keywords:
pulse oximetry, phothoplethysmography imaging, arterial blood oxygenation, tissue perfusion, functional perfusion mapping, human and animal studies
1. Introduction
In general, use of an unobtrusive method implies a major advantage for measurement in medicine. This particularly applies to photoplethysmography imaging (PPGI): a camera-based, contactless method for functional monitoring of skin perfusion (originally developed at RWTH Aachen University, Aachen, Germany [1]). Based on the same principle as classic photoplethysmography (PPG), PPGI measures the interaction of light with the irradiated skin tissue, depending mainly on its proportion of blood volume. PPGI can detect heart rate and respiration rate as well as their variability, the perfusion index (PI) and other derivable vital parameters [2]. Moreover, and in contrast to classic PPG, PPGI allows analysis of vital parameters with spatial resolution. If required, each pixel acquired with the camera’s charge-coupled device (CCD) sensor can be assumed to be a single classic skin-contact PPG sensor.
Details are presented on enhancement of the PPGI method to measure arterial blood oxygenation. For this, the pulse oximetry algorithm (well established in clinical practice for contact-based PPG measurements) is adapted for PPGI measurements. In addition, we describe the required modifications made to the PPGI setup, the analyzing algorithm used, and first validation of measurements.
2. Methods
2.1 PPGI
The basic principle of the PPGI setup is similar to that of classical PPG, i.e. PPGI detects small changes in light intensities arising from the observed skin. These result from changes in optical attenuation caused by changes in dermal blood volume based on arterial and venous hemodynamics.
Instead of the light-emitting diodes (LEDs) and the single photodetector of reflective-mode skin-contact PPG sensors, our PPGI setup uses monochromatic LED panels for illumination and the PIKE 210B (Allied Vision Technologies Ltd., Hod-Hasharon, Israel) CCD camera as sensor (Fig. 1). This camera has a dynamic range up to 96 dB and a readout speed of up to 31 fps at full-frame resolution (1928 x 1084 pixels). The readout speed can be increased if the frame size is reduced, or pixel binning is used. The camera has a sensitive spectral range of 320 - 950 nm.

During a PPGI measurement, a freely selectable skin region is placed in front of the camera at a distance of 0.2 to 2 m. Then, a video sequence is recorded and stored on the connected PC for post-processing and analysis: for every pixel, or a group of pixels inside a region of interest (ROI), the recorded intensity (or mean value respectively) is assigned to a time signal, depending on the recording time of the specific frame (Fig. 2) [3]. The time signals obtained are comparable to the classic PPG signals. For further processing, this allows to apply signal processing algorithms similar to those used for skin-contact measurements.
To apply the method of pulse oximetry on recorded data, it is necessary to record a PPG signals with at least two different wavelengths quasi-simultaneously. To comply with this requirement, a change in the illumination wavelength is triggered by the readout process of the camera. In this way, a sequence of illumination wavelengths is switched consecutively for every new frame. Then, measurement values are assigned with regard to the time of measurement and the wavelength used to receive the separate time signals for each wavelength.0.2 to 2 m. Then, a video sequence is recorded and stored on the connected PC for post-processing and analysis: for every pixel, or a group of pixels inside a region of interest (ROI), the recorded intensity (or mean value respectively) is assigned to a time signal, depending on the recording time of the specific frame (Fig. 2) [3]. The time signals obtained are comparable to the classic PPG signals. For further processing, this allows to apply signal processing algorithms similar to those used for skin-contact measurements.

To reduce disturbing effects of additional environmental illumination during measurement, the illumination sequence contains one time slot without any additional LED illumination. Then, this so-called ‘dark’ image is subtracted from the other images acquired with illumination.
2.2 ‘Classical’ pulse oximetry
Since the provision of an adequate supply of oxygen to skin and other organs is essential, for diagnostics it is important to identify pathological changes in oxygen intake or distribution as early as possible. Photometric measurement methods for registration of in vivo O2 (called oximetry) allow non-invasive determination of blood-oxygen saturation with sufficient accuracy. The principle of photometric oximetry was first described by Nicolai in 1932 [4] and further developed and tested for the monitoring of oxygen supply in fighter pilots during World War II. Modern arterial pulse oximetry is largely attributed to Aoyagi who, in 1974, used changes in the arterial pulse volume to determine oxygen saturation [5]. In 1980, Yoshiya et al. incorporated the method of PPG and oximetry into one instrument [6].
According to the Beer-Lambert Law, when light passes through absorbing media (like blood or skin tissue) its intensity I will decrease exponentially with the distance d [7]:

where I0 is the initial intensity and c the concentration of the absorbing material. The molar extinction coefficient ε of the absorbing material depends on the wavelength λ.
For blood, ε is strongly dependent on the state of hemoglobin and, thus, on its oxygenation. Fig. 3 shows the curve of ε for oxygenated and deoxygenated hemoglobin [8]. Depending on the blood oxygenation level and the wavelength used, the contrast between blood absorption and absorption in bloodless tissue will vary. From this the R-value can be defined, describing the ratio between the absorbance A of hemoglobin at two different wavelengths [9]:

A can be calculated directly from the PPG measurements and is dependent on the measured PPG intensity during systole and diastole (the local extreme values during the course of the PPG time series), measured separately with two different wavelengths (Fig. 4). Assuming that the heartbeat-related PPG signal component (AC) is significantly smaller than its mean intensity (DC), R can be simplified to the ratio of the ratios of AC to DC of the two wavelengths [10]. R is dependent on oxygenation and can be calculated from the recorded PPG sequences. For wavelengths at 660 and 940 nm, simplifying mathematical approximations have been suggested by (amongst others) Meiyappan et al. [11]

with A = 3.4; B = 3.1074 and C = 0.3983, and by Rusch et al.

with A = 110 and B = 25 [12]. Fig. 5 presents an example of the correlation between R and the oxygena-tion level [13].
The certainty of an assignment between R and the oxygenation level is dependent on the steepness of R. The more ε differs from the wavelengths used, the steeper R becomes. Therefore, it is advised to utilize wavelengths on both sides of the isosbestic point (at 805 nm). This correlation, which is derived by theoret-ical means, can be used in pulse oximeters. However, for practical purposes slightly drifted individual calibration curves are generally used instead of R. These calibration curves are usually setup during medical studies by assigning measurement values with reference values of a gold standard. Nevertheless, an approximation based on experimental data from the PPGI technique demonstrates the validity of the proposed system.


![Fig. 5: Example of the theoretical and empirical correspondence between oxygen saturation and the R-value (modified from [13]).](https://pl-master.mdcdn.cz/media/image/0500f004397e0ec9ff7360d7206fc659.png?version=1537792035)
2.3 Artifacts in PPGI sequences
To ensure safe evaluation of vital parameters, especially the quality of the PPG time series extracted from the PPGI sequence must be adequate. In particular, this means that the heart beat signal component must be clearly separable from the remaining signal, because most continuous analyzing algorithms are based on this as input parameter (e.g. heart rate, PI or SpO2 measurements based on estimation of the R-value).
As demonstrated in the animal study described in [15] (see section 3.3), under normal conditions this is not a problem. However, in contrast to skin-contact sensors, contactless monitoring can be influenced by artifacts from additional sources. Motion artifacts can occur if the object is moved relative to the position of the camera. Then, a single sensor pixel or ROI inside a video frame will not observe the light intensity of one and the same observed tissue region. Instead, the observed region shifts according to the motion of the object. If the measurable light intensity of the region moving into the ROI is almost identical to the region moving out of the ROI, the effect on the extracted PPGI time signal is minimal. However, in case of high contrast, this will lead to large steps in the PPG signal thereby masking vital parameters, e.g. during R-value estimation at a skin fold (3) or at the side of the hand (4) (Fig. 6). The intensity of the disturbance depends on the direction, frequency and amplitude of the mo-tion. To prevent these artifacts, during preprocessing motion detection and compensation algorithms can be applied.
![Fig. 6: Representative image of calculated R-values in the background and foreground of a PPGI sequence with visible noise artifacts in the background (1); reflection artifacts on the reference pulse oximeter (2); and motion artifacts at high-contrast image corners (3 & 4) [10].](https://pl-master.mdcdn.cz/media/image/85217f4ac9af8dc42f07446fa8d7cef9.png?version=1537795006)
Besides motion artifacts, variation in light conditions during measurements can also affect the results. Since most medical applications of PPGI occur indoors, the effects of variations in daylight can be neglected and environmental light can be controlled. The PPGI illumination units guarantee a suitably bright and homogenous illumination of the measurement object. Nevertheless, reflections of objects inside or close to the field of view of the camera onto the observed object, can also influence the monitoring. Fig. 6 provides an example: at the reflecting surface of the finger clip pulse oximeter (2), light originating from perfused skin is reflected. Because these light parts are modulated by a perfusion signal, an R-value similar to the adjacent skin region can be calculated even on the non-pulsating pulse oximeter. However, for correct interpretation of the PPGI data, such effects must be known. To suppress these effects, it is advised to reduce reflecting material (also diffuse reflecting material such as light-colored clothing) close to the observed objects.
Although most of the signal algorithms are also applicable on the image background, we still need to test whether reasonable analyses can be performed there. Nevertheless, a homogenous result can be assumed because no changes in detected light intensity should occur there. However, as shown in Fig. 6, in the cut-out of the background (1), a noisy pattern is visible. This is based on the thermal noise of the CCD sensor which is amplified by the evaluation algorithm, here estimation of the R-value. The ratio of the ratios is calculated from values close to but not equal to zero, both in the numerator and denominator, due to the noise transferred to the extracted PPG signal. Depending on how distinct the noise is at the wavelengths used, the calculated R-value may trend towards either zero or infinity.
3. Experimental validation
3.1 Measurements on healthy subjects
In 2010, preliminary validation of the PPGI setup was performed under laboratory conditions with 13 healthy volunteers [10]. For this, their hands and lower arms were positioned in an arm rest at a distance of 0.2 to 0.3 m in front of the camera.
For illumination, a combination of red and infrared light was used (630 and 905 nm). For each subject a video sequence of about 30 seconds duration was recorded. For reference, oxygenation was monitored by means of a finger clip pulse oximeter (Choice Medical MD300C22). For all volunteers and all measurements, oxygenation was above 95% (mean 98%).
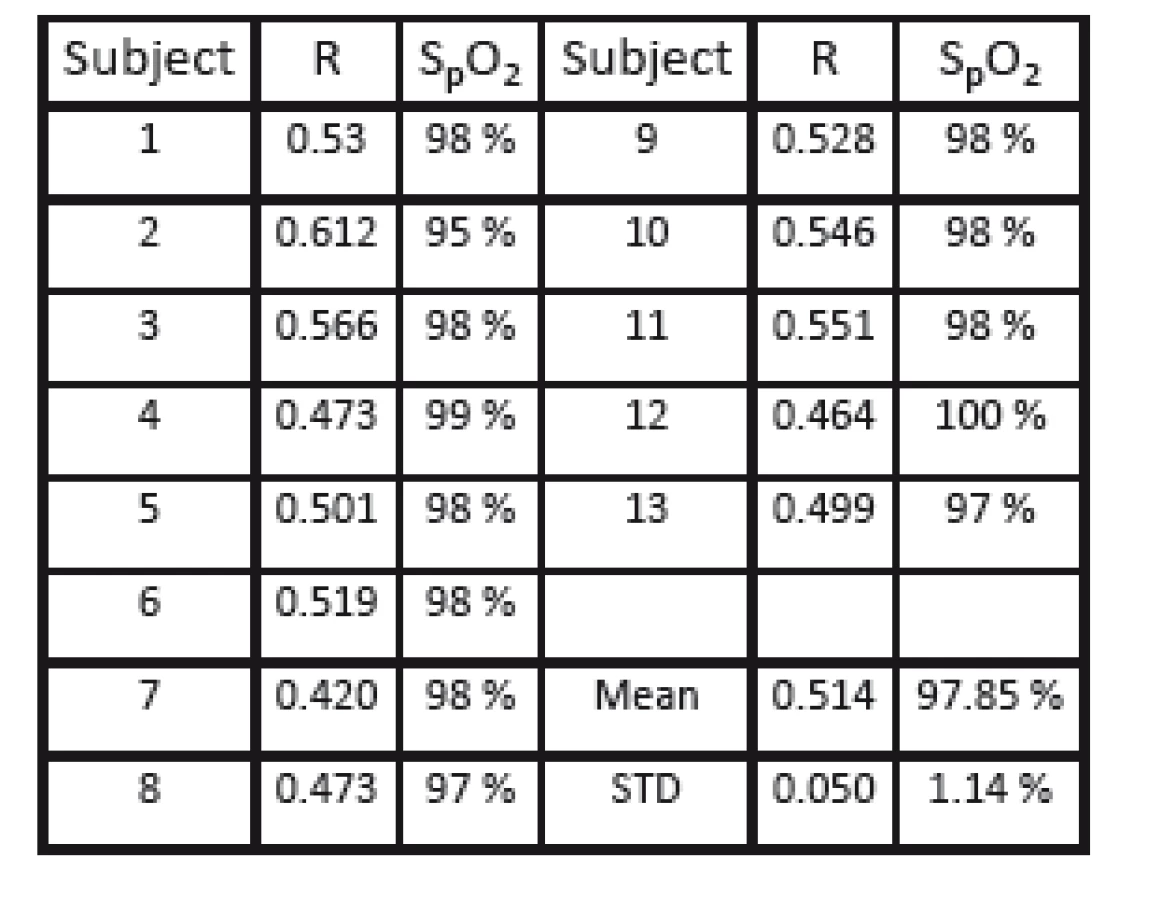
For further analysis, PPG signals were extracted from a small sliding ROI (a square with 6 pixels per side length) from a whole image frame. Based on the pulse oximetry method, the related R-value was calculated and shown at the specific position of the ROI in a functional representation with spatial resolution. Fig. 7 shows a representative example of the calculated functional mapping of R-values for red and infrared illumination. As expected for healthy subjects, a homogeneous coloring of practically all skin regions is visible, representing the same level of arterial blood oxygen saturation. Exceptions to this are only on high-contrast edges in the PPGI image (e.g. at the edge of the hand), the background, and artifacts from reflections on the mirroring surface of the pulse oximeter. Table 1 presents the calculated R-values for all volunteers (mean 0.514; standard deviation 0.050).

3.2 Measurement with pressure cuff
The proposed PPGI system should be able to detect a wide range of blood oxygenation levels. However, because in these tests the measurements were per-formed only in healthy volunteers, only physiological oxygenation levels could be measured.
To obtain measurements of oxygenation levels ≤ 95%, in a second self-experiment a pressure cuff is applied on the ring finger of the right hand to stop blood flow to the finger. Fig. 8 shows a reference image of the recorded frame (top) and the intensity of the detectable heartbeat-related perfusion amplitude (bottom) for the red wavelengths. This clearly shows that the perfusion intensity in the finger with the inflated tourniquet is drastically reduced. Since the application of pulse oximetry requires a detectable pulsation, this method is not directly applicable on the ring finger. To allow an assessment of oxygenation anyhow, the pressure in the tourniquet is modulated by a frequency of 1 Hz. This allows to detect artificial modulations of blood volume inside the finger. In contrast to physiological measurement in this setup, both the arterial and venous blood volumes were modulated; thus, the calculated R-value represents a mix from both these components. As reference measurement, oxygenation was measured by the finger clip pulse oximeter on the ring finger; this allowed to calculate the R-values presented in Table 2.


3.3 Results from animal trial
The PPGI system was tested during an animal trial (at the University Hospital of RWTH Aachen University) to examine the applicability of the system under realistic clinical situations in an operating theater. For this, anesthetized and mechanically ventilated domestic pigs with acute respiratory distress syndrome (ARDS) were monitored [14, 15]. This study was approved by the North Rhine-Westphalia State Regional Office for Nature, Environment and Consumer Protection (84-02.04.2012.A173).
During this study, a single episode of a rapid drop in oxygen saturation occurred. Although the animals were ventilated, oxygen saturation dropped from 95% to 71%-75% and then quickly recovered to 100% after increasing the oxygen concentration of ventilated air (to 100 %). Before, during and after this episode, the PPGI sequences were recorded and analyzed. The calculated R-values are presented in Table 3. As a reference, the Philips patient monitor (IntelliVue MP50) was used. In contrast to the above measur-ements, different wavelengths of the illumination were used (i.e. 616 and 830 nm). The PPGI camera and its view on the animal are presented in Fig. 9.
![Fig. 9: Experimental setup during the animal trial with the field of view of the PPGI camera on the anesthetized pig [13].](https://pl-master.mdcdn.cz/media/image/922dcd4da7a9c705be2e68edd96f3009.png?version=1537795310)

4. Results
The correlations derived from the measurements allow to define a calibration curve for the system. Note that, because calibration is dependent on the wavelengths used, the results of the experiments presented in sections 3.1 and 3.2 are not congruent to those presented in section 3.3. Nevertheless, all measurements show the same trend, which corresponds with the expected correlation that was determined theoretically. The results from the three different studies are presented in Fig. 10.

5. Application of PPGI
Multiple vital parameters (e.g. heart rate and respiration rate, perfusion index, and as shown arterial oxygen saturation) can be monitored with the PPGI system. Therefore, this setup is particularly suited for clinical applications which benefit from its non-contact, unobtrusive monitoring technique, e.g. for the monitoring of preterm and term infants cared for in an incubator. Classically, the vital parameters of these small infants were observed using cable-connected skin-contact sensors, such as adhesive electrocardi-ogram (ECG) electrodes attached to the chest and PPG sensors often clipped to the foot. However, all types of skin contact carry the additional risk of harming the immature paper-thin skin and increase the risk of infections. These undesired side-effects can be overcome by applying non-contact, camera-based PPGI. In addition, by avoiding cable-connected sensors, accessibility of the child is improved. This simplifies handling of the infant and decreases the amount of nursing required. Moreover, it increases the positive effect on the child’s social relationship with parents by allowing better direct contact.
Besides guaranteeing the status quo for monitoring of the well-established vital parameters (heart rate, respiration rate, SpO2), the PPGI system also supports diagnostic analyzing methods. Hereby, the PPGI system benefits from its spatial resolution. Analysis is not restricted to a single measurement location, such as the position of a skin-contact sensor. Instead, the development and spatial distribution of the parameters can be determined and used for diagnostic purposes.
For successful treatment of inflammatory diseases, early diagnosis is very important. Such inflammations, especially in an early stage, appear locally and are accompanied by local changes of perfusion in the affected tissue. If this region is visible in the field of view of the PPGI camera, the probability of early recognition is greater than when using a single skin-contact sensor. As local inflammations and, in particular, development of sepsis have a strong deleterious impact on the mortality and morbidity of neonates, it is recommended to use the PPGI monitoring properties 24/7 as an early warning system.
6. Discussion
In addition to the results presented here, the feasibility of the proposed extension for video analysis has also been demonstrated by others [16-17]. All these researchers extracted data on perfusion depending on the time signals from video sequences as a basis for applying the pulse oximetry method or other forms of signal analysis.
However, all confirm that the accuracy of the estimated oxygenation level (or even other derived magnitudes) is strongly dependent on the accuracy of the extracted amplitude of a PPG (heart beat) signal. The quality of this signal can be improved either by analyzing the detected light intensity inside larger ROIs instead of single pixels, or by using more sensitive sensor chips (with a high dynamic range), or a combination of both. However, analysis of larger ROIs is associated with some loss of spatial resolution. Consequently, our PPGI system featuring a highly sensitive CCD camera allows highly precise results together with additional spatial resolution.
Other advantages of these PPGI techniques include: i) its easy-to-use setup, ii) functional mapping of estimated vital parameters offering an intuitive access for interpretation, and iii) the unobtrusiveness of the measurement technique that supports a wide range of possible applications. The system is especially suited for long-term applications in the monitoring of skin regions that ‘classic’ skin-contact sensors do not cover. Furthermore, local effects are more easily detectable due to its spatial resolution.
Supplementary Notes
Parts of this paper have been pre-published during the 18th International Student Conference on Electrical Engineering, Poster Conference 2014, Czech Technical University in Prague, Czech Republic.
Nikolai Blanik
Philips Chair for Medical Information Technology Helmholtz-Institute for Biomedical Engineering
RWTH Aachen University
Pauwelsstr. 20, D-52074 Aachen
E-mail: blanik@hia.rwth-aachen.de
Phone: +49 241 80 23228
Sources
[1] BLAZEK, V., SCHULTZ-EHRENBURG, U. Frontiers in computer-aided visualization of vascular functions, VDI Verlag, Düsseldorf, 1998, ISBN 3-18-326320-3.
[2] HUELSBUSCH, M. A functional imaging technique for optoelectronic assessment of skin perfusion. PhD thesis, 2008, RWTH Aachen University.
[3] BLANIK, N., BLAZEK, C., PEREIRA, C.B., BLAZEK, V. LEONHARDT, S. Frequency-selective quantification of skin perfusion behavior during allergic testing using photoplethysmography imaging, In Proceedings of SPIE Medical Imaging 2014, pp. 9034-9078.
[4] NICOLAI, L. Über Sichtbarmachung, Verlauf und chemische Kinetik der Oxyhämoglobinreduktion im lebenden Gewebe, besonders in der menschlichen Haut, Arch Ges Physiol 229, 1932, pp. 372-389.
[5] AOYAGI, T., KISHI, M., YAMAGUCHI, K., WATANABE, S. Improvement of an earpiece oximeter. In: Abstracts of the 13th annual meeting of the Japanese Society for Medical Electronics and Biological Engineering. Osaka, 1974, 90-91.
[6] YOSHIYA, I., SHIMADA, Y., TANAKA, K. Spectrophotometric monitoring saturation in the fingertip. Med Biol Eng Comp 18, 1980, pp. 27-32.
[7] BEER, A. Bestimmung der Absorption des rothen Lichts in farbigen Flüssigkeiten. Annalen der Physik und Chemie, 1852, 86, Erstes Stück, pp. 78–88.
[8] ZIJLSTRA, W.G., BUURSMA, A., ASSENDELFT, O.W. Visible and Near Infrared Absorption Spectra of Human and Animal Haemoglobin: Determination and Application, VSP, 2000.
[9] WEBSTER, J.G., Design of Pulse Oximeters, Bristol and Philadelphia:Institute of Physics Publishing, 1997.
[10] BLANIK, N. Konzept und Realisierung eines kontaktlosen Messsystems für die ortsaufgelöste Erfassung der Sauerstoffsättigung der Haut, diploma thesis, 2010, RWTH Aachen University.
[11] MEIYAPPAN, S., PRAKASCH, O. Development of software for pulse oximeter and investigation of its realtime response in clinical environment, Int. J. Clin. Monit. Comp. 7(1), 1990, pp. 45-57.
[12] RUSCH, T.L., SANKAR, R., SCHARF, J.E., Signal processing methods for pulse oximetry, Comput. Biol. Med., 26(2), 1996, pp. 143-159.
[13] SCHOELLER, B. Pulsoximetrie Fibel, MCC GmbH, 1994.
[14] CZAPLIK, M., BIENER, I., LEONHARDT, S., ROSSAINT, R. Setting ventilation parameters guided by Electrical Impedance Tomography (EIT) in an animal trial of Acute Respiratory Distress Syndrome (ARDS), In Proceedings of SPIE Medical Imaging 2014, pp. 9038-9071.
[15] BLANIK, N. PEREIRA, C.B., CZAPLIK, M., BLAZEK, V., LEONHARDT, S. Remote Photopletysmographic Imaging of Dermal Perfusion in a Porcine Animal Model, In IFMBE Proceedings of ICBME 2013, Springer, 2013, pp. 92-95.
[16] WIERINGA, F.P., MASTIK, F., VAN DER STEHEN, A.F.W. Contactless multiple wavelength photoplethysmographic imaging: a first step towrd ‘SpO2 camera’ technology, Ann. Biomed. Eng., 33(8), 2005, pp. 1034-1041.
[17] ZHENG, J., HU, S. The preliminary investigation of imaging photoplethysmographic system, In J. Phys. Conf. Ser., 85, 012031, 2007.
[18] WU, H.-Y., RUBINSTEIN, M., SHIH, E., GUTTAG, J. DURAND, F., FREEMAN, W. Eulerian Video Magnification for Revealing Subtle Changes in the World, In ACM Transactions on Graphics, Proceedings SIGGRAPH, 31(4), 2012.
Labels
BiomedicineArticle was published in
The Clinician and Technology Journal

2014 Issue 3
Most read in this issue
- The effects of airway resistance and alveolar compliance upon delivered tidal volume during high frequency oscillatory ventilation
- Health Technology Assessment for Medical Devices
- Monitoring of EMG to force ratio using new designed precise wireless sensor system
- Remote Pulse Oximetry Imaging – Fundamentals and Applications