
OPTIC CHIASM WIDTH IN NORMAL-TENSION AND HIGH-TENSION GLAUCOMA
Authors:
J. Lešták 1; M. Kyncl 1; M. Fůs 1; K. Marešová 2
Authors‘ workplace:
Oční klinika JL Fakulty biomedicínského inženýrství ČVUT v Praze
1; Oční klinika Lékařské fakulty Univerzity Palackého a Fakultní nemocnice Olomouc
2
Published in:
Čes. a slov. Oftal., 76, 2020, No. 3, p. 126-128
Category:
Original Article
doi:
https://doi.org/10.31348/2020/21
Overview
Purpose: The aim of our study was to find out whether in patients with hypertensive glaucoma (HTG) and normotensive glaucoma (NTG), there is a change in the size of the chiasm depending on the changes in the visual field. Therefore, we retrospectively measured the width of the chiasm in the patients to whom we measured the size of the corpus geniculatum laterale in 2013.
Materials and methods: The group consisted of two groups of patients. Nine with hypertensive glaucoma (HTG) and nine with normotensive glaucoma (NTG). The diagnosis was based on a complex ophthalmological examination and in NTG and electrophysiological examination. The visual field was examined by a rapid threshold program on the Medmont M700. The sum of the sensitivity from both visual fields in the range of 0-22 degrees was compared with the width of the chiasm obtained by the magnetic resonance imaging using the eight channel head coil. The measured values of all subjects were analyzed using a paired t-test and a correlation coefficient.
Results: We found a reduction in the chiasma width in both glaucoma groups. We found a statistically significant difference in the size of the chiasm (p = 0.0003) between the control group and the HTG group (p = 0.001). The narrowing of the chiasm showed a slight correlation in HTG with changes in the field of vision (r = 0.139) and in NTG a moderate correlation (r = 0.375).
Conclusion: We found a reduction in the size of the chiasm in both HTG and NTG. The sum of sensitivities in the central parts of the visual field, however, more correlated with the reduction in the size of the chiasm in NTG. This finding shows that there are two different diagnostic groups.
Keywords:
MRI – normotensive glaucoma – Hypertensive glaucoma – optic chiasm width – changes in visual field
INTRODUCTION
The fundamental stated difference between high-tension glaucoma (HTG) and normal-tension glaucoma (NTG) is the level of intraocular pressure. Even if changes on the optic nerve papilla are similar in both diagnostic groups, their cause may be different. For this reason, in our studies we attempt to highlight the difference between both pathologies, including their cause.
In our previous study “The anterior visual pathway in normal-tension glaucoma”, where we dealt with the issue of cerebrospinal fluid pressure (CSF-P), which in the pathogenesis of NTG may have a similar effect on the retrobulbar region of the orbit as increased intraocular pressure has on the lamina cribriformis, we also determined a statistically significant difference in the width of the chiasm [1]. In this study we focused on whether a similar correlation exists between changes in the visual field and chiasm width.
As a result we retrospectively evaluated the results of examination of the peripheral part of the visual pathway, in which in a previous study we had compared the size of the corpus geniculatum laterale in HTG and NTG [2].
COHORT AND METHOD
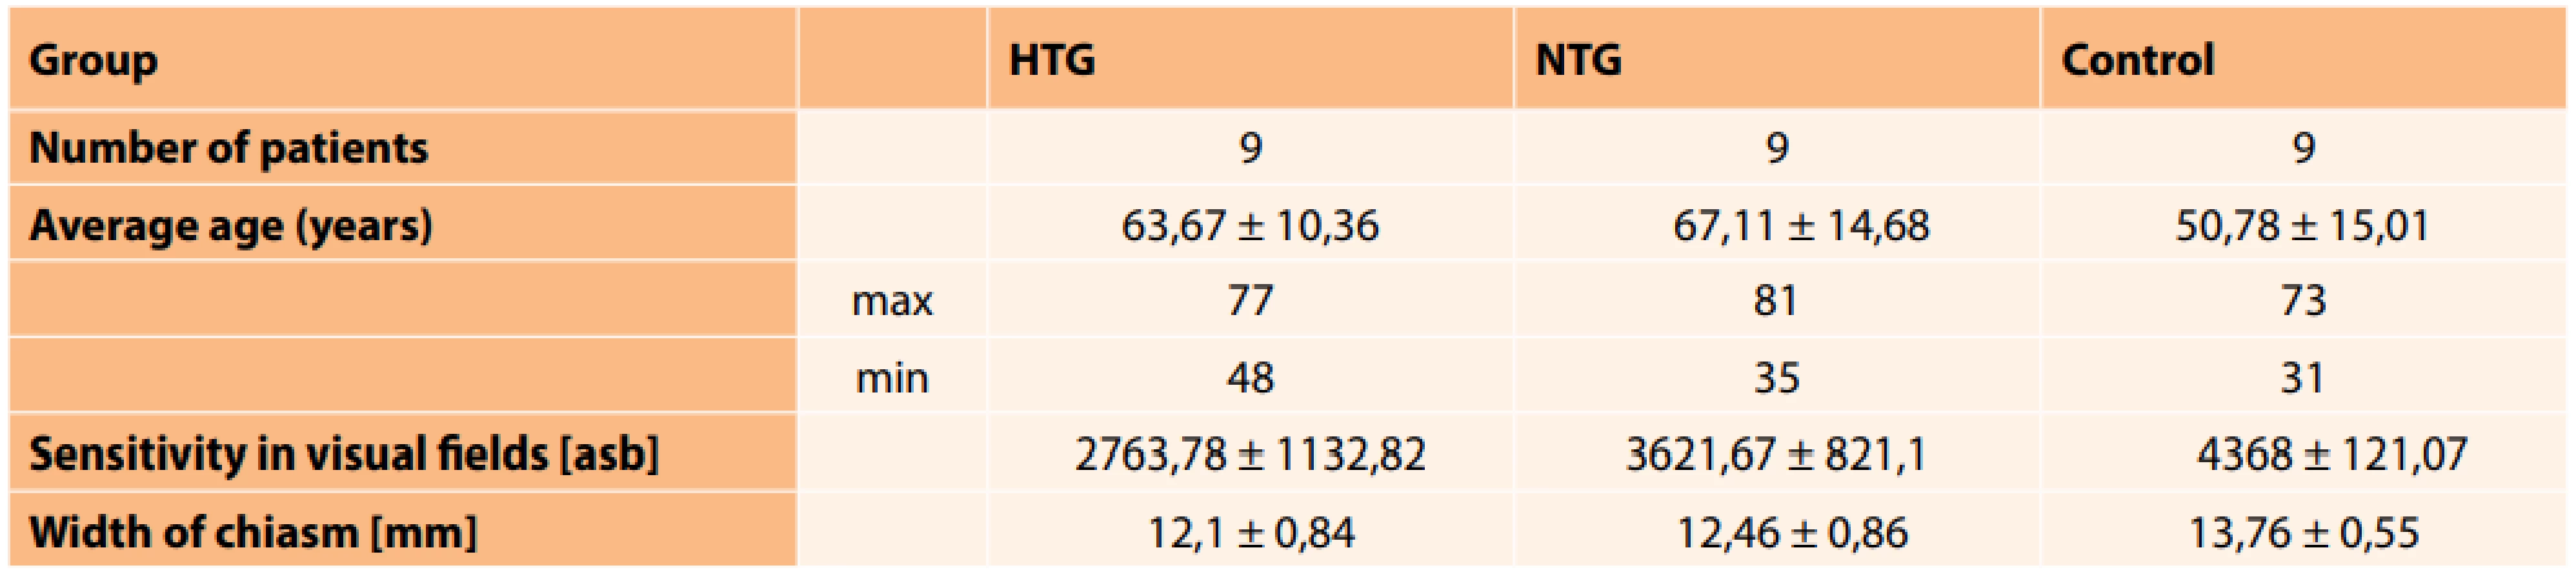
The cohort comprised 18 patients, 9 with HTG (3 women and 6 men aged from 35 to 81 years) and 9 with NTG (6 women and 3 men aged from 48 to 77 years). A control group was composed of nine healthy individuals (4 women and 5 men aged from 31 to 73 years). We conducted a comprehensive ophthalmological examination on all the patients, including biomicroscopy, gonioscopy, diurnal curve of intraocular pressure (IOP), perimetry, examination of the retinal nerve fibre layer and in the case of NTG also an electrophysiological examination of sight. After any applicable correction of less than ± 3 dioptres, visual acuity was 1.0. The patients did not have any other neurological pathologies, and structural examination of the brain using magnetic resonance imaging (MRI) was normal. We conducted an examination of the visual field using the instrument Medmont M700 (Medmont Pty Ltd., Victoria 3124, Australia), with the use of a fast threshold glaucoma program. We determined sensitivity in the visual fields by means of a simple sum of all the examined points on a scale of 0-22 degrees in both visual fields. The values are in apostilbs (asb = 3.14 cd/m2).
MRI examination of the brain and optic chiasm was performed on a 3T MR instrument (Philips Achieva TX series release 3.2.1.1, Netherlans) with the use of an 8 channel head coil. The following sequences were used: sagittal level 3D T1 TFE (TR/TE 8/3, 8, 160-170 layers, acquisition voxel 1 x 1 x 1, FOV 240 x 240, Sense 1.7, NSA 1) and coronal level T2 TSE (TR/TE 3000/80, 28-30 layers, 4 mm gap, incision width 1 mm, FOV 240 x 240, TSE factor 15, ACQ voxel 0,57 x 0.74 x 4, NSA 1). An analysis of the image documentation was conducted by a neuroradiologist with several years’ experience, the parameters were quantified from the coronal reconstruction of the 3D T1 TFE image. The data was evaluated on an Extended MR Workspace work station (EWS Philips, version R2.6.3.1). Coronal reconstruction of the T1 image in the place of horizontal visualisation of the chiasm with classic dumbbell profile was used for measurement and mathematical evaluation of the chiasm.
RESULTS
The mean measured values are presented in table 1. We determined a statistically significant difference in the size of the chiasm (p = 0.0003) between the control group and the group with HTG, similarly between the control group and the group with NTG (p = 0.001). The correlation between sensitivity of the visual field (VF) and the width of the chiasm (WCh) in HTG was weak (r = 0.139), and medium in the case of NTG (r = 0.375). Table 2 presents the correlation coefficients between the width of the chiasm and the sum of sensitivities in the visual fields (p = 0.05) in the group with HTG, the group with NTG and the control group.
![Correlation coefficient between width of chiasm (WCh)
and sensitivity in visual fields (VF) (p = 0.05). [Weak (r < 0.3), medium (0.3 < r < 0.8) and strong (r > 0.8)]](https://pl-master.mdcdn.cz/media/cache/media_object_image_large/media/image_pdf/63cdcbaac3a751fc6078d37b95350c23.png)

DICUSSSION
In comparison with HTG (in addition to high intraocular pressure), NTG is different in terms of changes in the visual field, in which we find more changes in the central part in the case of NTG, with deeper defects of sensitivity [3,4,5], the nerve fibres are more damaged in the central part of the retina in NTG and the damage is of a focal character [6]. In HTG diffuse damage occurs to the ganglion cells throughout the entire retina, in which magnocellular cells are more damaged, and their axons subsequently also decay. The length of time that elapses between the occurrence of these changes and the alteration of subcortical and cortical visual centres in the brain is not precisely known. In contrast with HTG, in the case of NTG the electrical response of the ganglion cells is relatively good. However, alteration occurs in the visual pathway [7]. Approximately 80 % of parvocellular and 10 % of magnocellular ganglion cells are located in the retina [8], in which the majority of parvocellular cells are located in the macula. In HTG a greater loss of magnocellular cells of the retina takes place [9]. As a result, in the initial stages of HTG it is not possible to demonstrate similar changes in the central part of the visual field as in the case of NTG. On the basis of these observations, it is possible to assume that in HTG the changes in the central part of the visual field will correlate to a lesser extent with changes in the optic chiasm as is the case in NTG.
Changes in the optic chiasm are known in glaucoma. Some studies do not differentiate between these changes in HTG and NTG [10,11,12,13,14]. Zhang et al. examined the peripheral part of the visual pathway in NTG with the aid of MRI, and determined that constriction of the optic nerve and reduction of the size of the chiasm and the corpus geniculatum laterale correlates with a diminution of the RNFL [15].
Kashiwagi et al. similarly demonstrated a correlation in the size of the optic nerve and the chiasm in MD (medium defect) upon examination of the visual field in HTG and NTG [16].
In our study, in contrast with the previous authors, we compared the sum of sensitivities in the central part of the visual fields (0-22 degrees) with the size of the chiasm. We determined a statistically significant difference in both diagnosed groups, in the group with HTG p = 0.0003, in the group with NTG p = 0.001. However, the sum of sensitivities in the central parts of the visual fields correlated more with the size of the chiasm in NTG. This finding also indicates that this concerns two different diagnostic groups.
We are aware of the shortcoming of this study, consisting in the small number of subjects. Despite this, we demonstrated that even in a small cohort, the differences between HTG and NTG are demonstrable.
CONCLUSION
In both HTG and NTG we demonstrated changes in the size of the optic chiasm in comparison with a control group. However, the sum of sensitivities in the central parts of the visual fields correlated more with the size of the chiasm in NTG. This finding also indicates that this concerns two different diagnostic groups.
Sources
1. Kyncl M, Lestak J, Sverepa M, Ettler L, Rozsival P.: The anterior visual pathway in normal-tension glaucoma. Indian Journal of Research. 2015 Jan;4(1):10–14.
2. Lestak J, Kyncl M, Svata Z, Rozsival P.: Lateral Geniculate Nucleus in Hypertensive and Normotensive Glaucoma. J Clin Exp Ophthalmol. 2013 Feb;4(2): DOI:10.4172/2155-9570.1000269.
3. Araie M, Yamagami J, Suziki Y.: Visual field defects in normal-tension and high-tension glaucoma. Ophthalmology. 1993 Dec;100(12):1808–1814.
4. Lestak J, Nutterova E, Bartosova L, Rozsival P.: The Visual Field in Normal tension and Hypertension Glaucoma. International Journal of Scientific Research. 2014 Dec;3(12):49–51.
5. Lester M, De Feo F, Douglas GR.: Visual field loss morphology in high-and normal-tension glaucoma. J Ophthalmol. 2012 Feb; 327326. [Epub 2012: doi:10.1155/2012/327326].
6. Shin IH, Kang SY, Hong S, Kim SK, Seong GJ, Tak MK. et al.: Comparison of OCT and HRT findings among normal tension glaucoma, and high tension glaucoma. Korean J Ophthalmol. 2008 Dec;22(4): 236–241.
7. Lestak J, Nutterova E, Pitrova S, Bartosova L.: High tension versus normal tension glaucoma. A comparison of structural and functional examinations. J Clin Exp Ophthalmol. 2012 Mar; S:5. [Epub doi.org/10.4172/2155-9570.S5-006].
8. Prasad S, Galetta SL. Handbook of Clinical Neurology. 102. Amsterdam (The Netherlands): Elsevier; 2011. Anatomy and physiology of the afferent pupilary systém; 3–19.
9. Shou T, Liu J, Wang W, Zhou Y, Zhao K.: Differential dendritic shrinkage of alpha and beta retinal ganglion cells in cats with chronic glaucoma. Invest Ophthalmol Vis Sci. 2003 Jul;44(7): 3005–3010.
10. Erzos MG, Peckevik Y, Ayintap E, Gunes IB, Mart DK, Yucel E. et al.: MR Imaging of the Anterior Visual Pathway in Primary Open-Angle Glaucoma: Correlation with Octopus 101 Perimetry and Spectralis Optical Cherence Tomography Findings. Curr Eye Res. 2013 May;42(7): 995–1001.
11. Hernowo AT, Boucard ChC, Jansonius NM, Hooyman JM, Cornelissen FW. et al: Automated Morphometry of the Visual Pathway in Primary Open-Angle Glaucoma. Invest Ophthal & Vis Sci. 2011 Apr;52(5): 2758–2766.
12. Iwata F, Patronas NJ, Caruso RC, Podqor MJ, Remaley NA, Kupfer C. et al: Association of Visual Field, Cup-Disc Ratio, and Magnetic Resonance Imaging of Optic Chiasm. Arch Ophthalmol. 1997 Jun;115(6): 729–733.
13. Murai H, Suzuki Y, Kiyosawa M, Tokumaru AM, Ashii K, Mochizuki M.: Positive correlation between the degree of visual field defect and optic radiation damage in glaucoma patients. Jpn J Ophthalmol. 2013 May;57(3):257–262.
14. Omodaka K, Murata T, Sato S, Takahashi M, Nagasaka T, Doi H. et al.: Correlation of magnetic resonance imaging optic nerve parameters to optical coherence tomography and the visual field in glaucoma. Clin and Exp Ophthalmol. 2014 May-Jun;42(4):360–368.
15. Zhang YQ, Jing LiJ, Xu L, Wang ZC, Yang H, Chen CX. et al.: Anterior visual pathway assessment by magnetic resonance imaging in normal-pressure glaucoma. Acta Ophthalmol. 2012 Jun;90(4):e295–302.
16. Kashiwagi K, Okubo T, Tsukahara S.: Association of magnetic resonance imaging of anterior optic pathway with glaucomatous visual field damage and optic disc cupping. J Glaucoma. 2014 Jun;13(3):189–195.
Labels
OphthalmologyArticle was published in
Czech and Slovak Ophthalmology

2020 Issue 3
Most read in this issue
- PRES SYNDROME
- EXTERNAL OPHTHALMOMYIASIS CAUSED BY OESTRUS OVIS (A CASE REPORT)
- TRAUMA IN OCULOPLASTIC SURGERY A REVIEW
- CHANGES OF THE FOVEAL AVASCULAR ZONE AND MACULAR MICROVASCULATURE WITHIN THE FRAMEWORK OF OCT ANGIOGRAPHY EXAMINATION IN YOUNG PATIENTS WITH TYPE 1 DIABETES (PILOT STUDY)